Clear Sky Science · en
A framework for impact based heat stress warning system for a coastal city in India
Why city heat is more dangerous than you think
For millions of people living in big coastal cities, hot days are becoming more than just uncomfortable—they can be deadly. This study looks at Mumbai, one of the world’s largest and fastest-growing cities, to understand where heat is most dangerous and why some neighborhoods suffer more than others. By blending weather models, satellite images, and detailed census data, the researchers build a ward-level heat risk map that city planners can actually use to protect people before the next big hot spell arrives.
A coastal city under growing pressure
Mumbai’s rapid growth has replaced trees and open land with concrete, asphalt, and high-rise buildings. This change traps heat, producing what is known in everyday terms as a “city heat island,” where built-up areas stay hotter than nearby countryside or water. At the same time, climate change is bringing more frequent and intense hot spells. People who work outdoors, older adults, children, and low-income communities are especially vulnerable. The authors focus on the April–May 2024 heat event, examining how this coastal city, with its long shoreline and dense population, experienced and distributed dangerous heat across its 24 administrative wards.
Measuring how hot it feels on real city streets
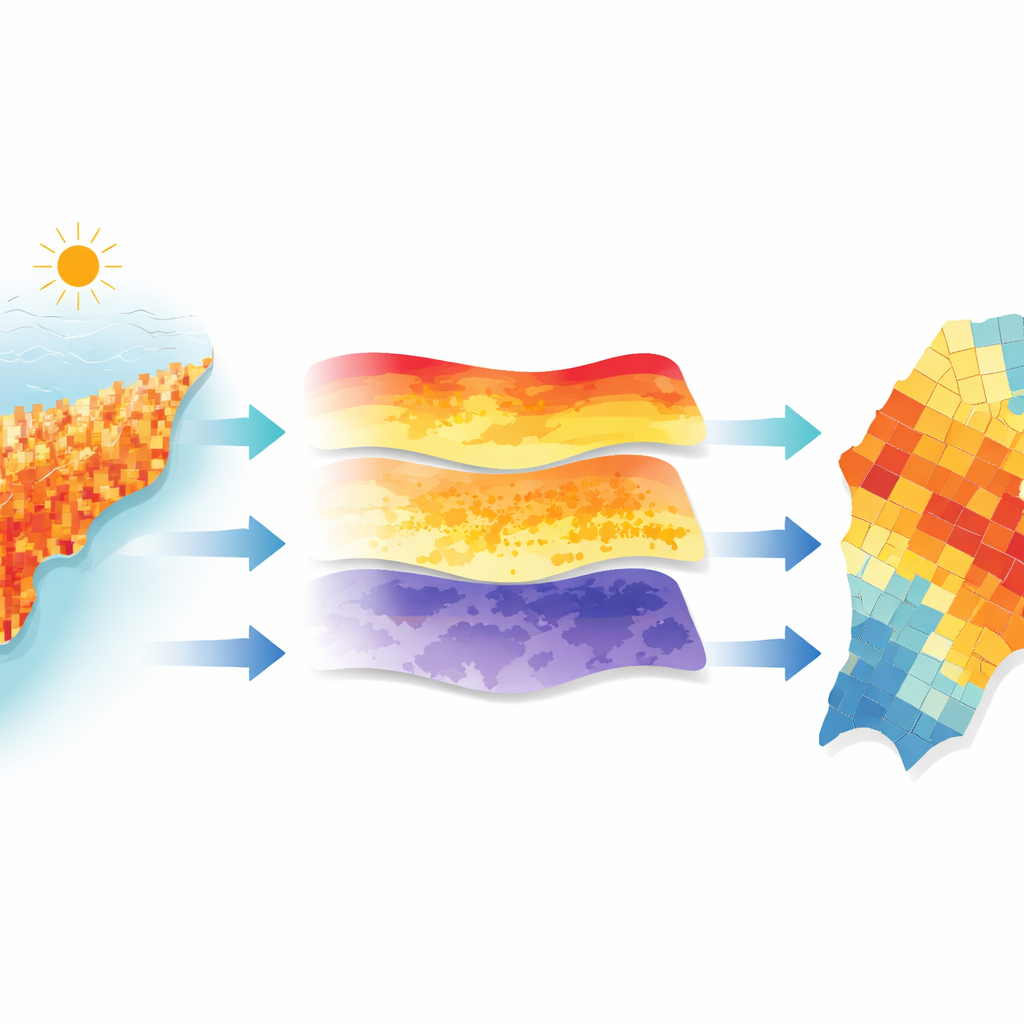
Instead of looking only at air temperature, the team uses the Universal Thermal Climate Index, or UTCI, which captures how hot it actually feels to a person by combining temperature, humidity, wind, and sunlight. They run an advanced weather model tailored for cities, which represents streets, buildings, and land-cover types at a fine scale of 333 meters. Satellite data from Landsat are used to map land surface temperatures, while 36 ground weather stations help check that the model is realistic. The result is a detailed picture of when and where in Mumbai heat stress peaks. During the 15-day period, UTCI values over the city mostly fell into the “very strong heat stress” range, with the hottest conditions in eastern inland wards and somewhat lower stress along the western coast where sea breezes offer some relief.
From heat maps to human risk
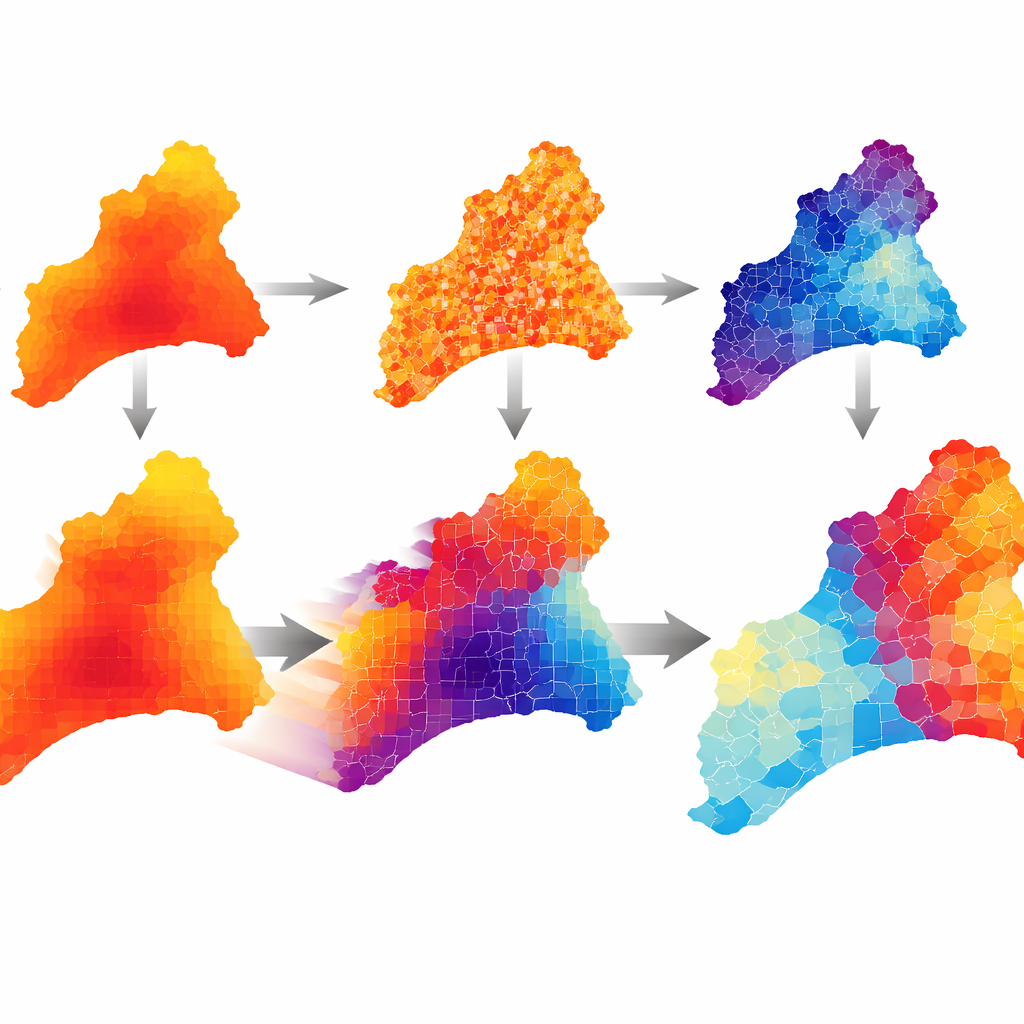
High heat alone does not tell the full story. Two neighborhoods with the same temperature can have very different risks, depending on who lives there and what services they have. To capture this, the researchers build two additional indices. A vulnerability index reflects how sensitive people are, using ward-level information on population density, household crowding, and the share of residents from socially weaker groups. An exposure index tracks how hard it is for people to protect themselves, drawing on census data about marginal workers, illiteracy, poor-quality housing, lack of electricity, unsafe or untreated water, and long distances to water sources. Using a statistical technique called principal component analysis, they combine these many indicators into single vulnerability and exposure scores for each ward.
Where danger concentrates in the city
To estimate overall danger, the team multiplies three pieces together: the heat hazard (UTCI-based), the vulnerability index, and the exposure index. This produces a Heat Stress Risk Index (HSRI) for each ward, then grouped into five levels from “Low” to “Highest.” No ward falls into the very lowest category, and every part of Mumbai faces at least strong heat. About 8.3% of wards land in the highest risk class and 16.7% in the high-risk class, mostly where substantial heat overlaps with crowded living conditions and poor services. Interestingly, some coastal wards show high heat hazard but only low to moderate risk, because residents are less exposed or more able to cope. Conversely, a few wards with only moderate heat still end up in higher risk classes because social and infrastructural disadvantages are so severe.
Turning maps into action for safer summers
The authors conclude that focusing only on temperature is not enough to protect people from dangerous heat. Their framework shows that risk is a product of climate, city form, and social conditions. In Mumbai, that means cooling the hottest neighborhoods with trees, reflective materials, and better airflow; improving housing, electricity, and safe water in high-exposure areas; and prioritizing densely populated and socially weaker wards for health services and early warnings. Although limited by the age and resolution of census data, the approach is designed to be repeated and refined as new information becomes available. In plain terms, it offers city officials a practical heat-risk map that can guide investments and policies to keep residents safer in an ever-warming world.
Citation: Kacker, K., Utpal, A., Singh, S. et al. A framework for impact based heat stress warning system for a coastal city in India. Sci Rep 16, 12254 (2026). https://doi.org/10.1038/s41598-026-38639-9
Keywords: urban heat stress, Mumbai, heat risk mapping, climate resilience, vulnerable communities