Clear Sky Science · en
Estimation of surface PM2.5 over the Indo-Gangetic Basin using MERRA-2 reanalysis and machine learning
Why this study matters to everyday life
For millions of people living across northern India, breathing clean air is a daily concern rather than an abstract ideal. The Indo-Gangetic Basin, home to several of the world’s most polluted cities, often experiences fine particle levels far above health guidelines. This study asks a practical question with major consequences for public health and policy: how can we use modern data and smart computer methods to see the true picture of harmful fine particles in the air, even in places with few monitoring stations?
The problem with tiny particles in the air
Fine particles, known as PM2.5 because they are smaller than 2.5 micrometers, are small enough to reach deep into the lungs and enter the bloodstream. They are linked to heart and lung disease, strokes, and early death. In the Indo-Gangetic Basin, these particles come from vehicle exhaust, factories, coal burning, household fuel use, road and construction dust, and large-scale burning of crop residues after harvest. Geography makes things worse: mountains to the north and high land to the south act like walls, so air does not mix and clear out easily. During winter and after the monsoon, calm winds, shallow mixing layers, and temperature inversions trap pollution close to the ground, creating the long, hazy episodes that residents know all too well.
Looking beyond a patchy monitoring network
India’s pollution control authority runs hundreds of automatic stations that measure PM2.5 at the ground. These instruments provide reliable numbers for cities like Delhi, Lucknow, Kanpur, and Patna, but large stretches of smaller towns and rural areas remain unmeasured. To fill these gaps, scientists often use NASA’s MERRA-2 reanalysis, a global product that blends weather models with satellite and other observations to estimate pollution. However, MERRA-2 looks at the world in relatively large grid boxes and relies on simplified physics, so it tends to underestimate near-surface PM2.5, especially during severe pollution episodes. The authors confirm this shortcoming: for the four cities studied over 2014–2023, MERRA-2 captures the seasonal ups and downs but misses the full height of the peaks and the day-to-day swings seen by ground monitors.
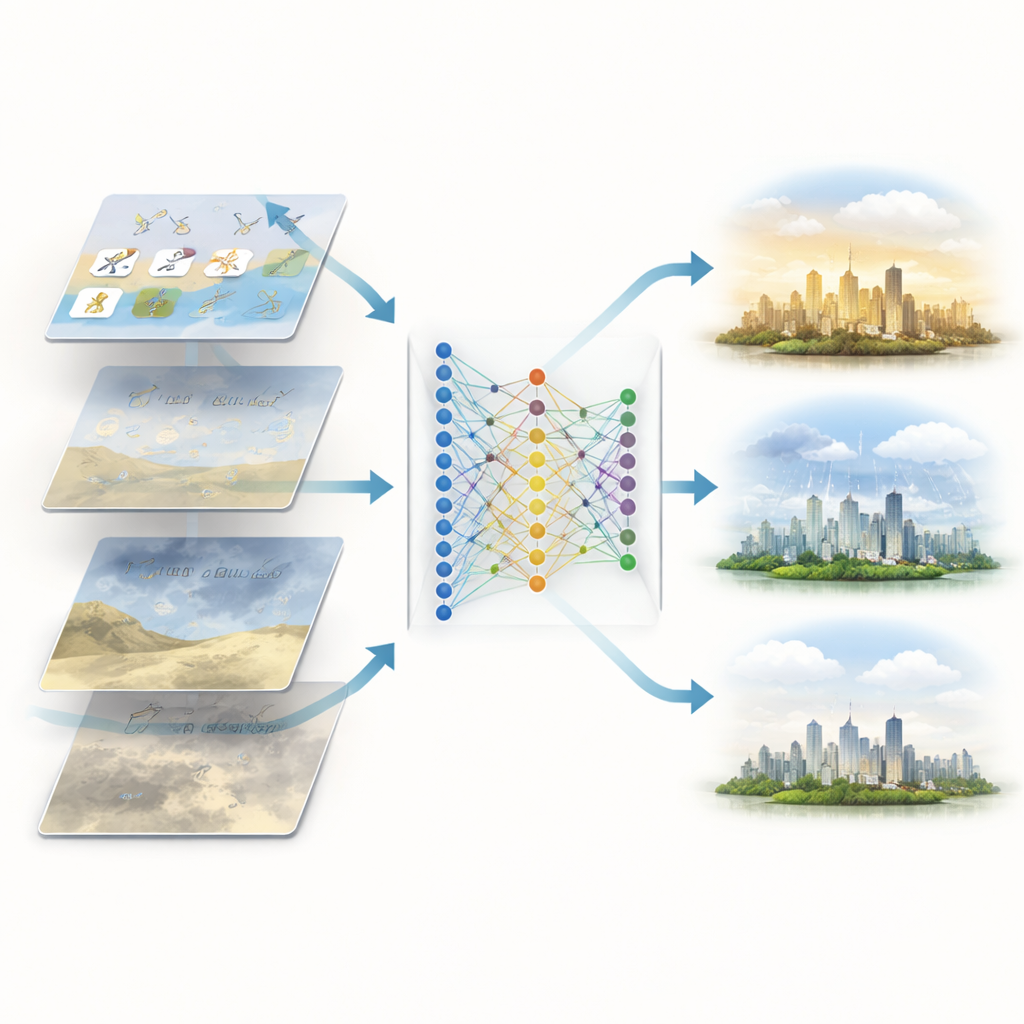
Teaching computers to combine many clues
To overcome these limits, the team built a machine learning framework that learns from both the reanalysis and the ground data. They fed the models with two main types of information: the different ingredients of fine particles (such as dust, soot, and sulphate) from MERRA-2, and key weather factors like temperature, humidity, wind speed, rainfall, and the depth of the layer of air that mixes near the surface. Using several modern algorithms and then combining them in a “stacking” ensemble, the computer learned how these variables jointly relate to the actual daily PM2.5 observed in each city. The best model cut typical errors by more than half compared with raw MERRA-2, matched almost all observations within a factor of two, and removed the strong low bias. It was able to reproduce both the extreme winter spikes above 300 micrograms per cubic meter and the much cleaner monsoon days below 50, something the original reanalysis could not do.
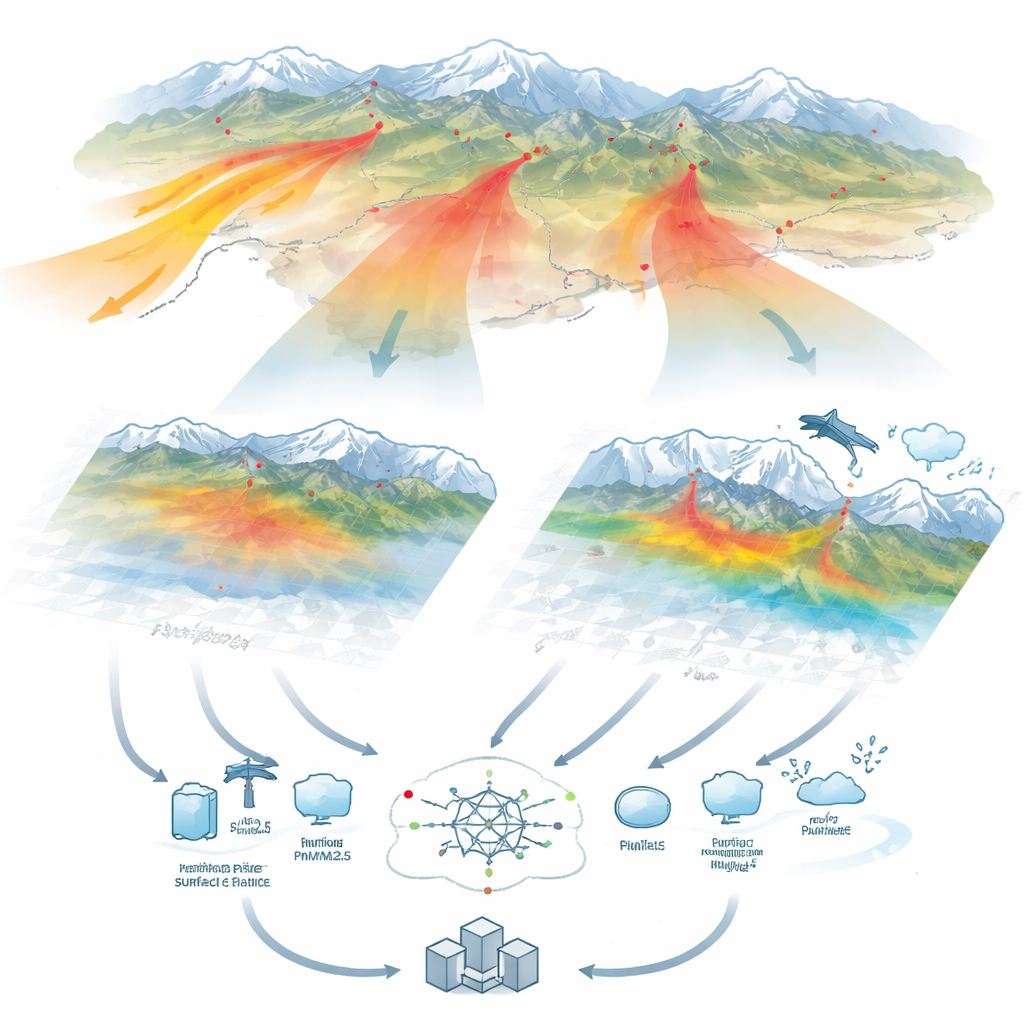
Tracing where dirty air really comes from
The study went a step further by asking not only how much pollution there is, but where it comes from. Using a widely used trajectory model, the researchers followed air masses backward in time for five days to see which regions typically send air toward each city. They then combined these paths with the measured PM2.5 levels to highlight the areas most strongly linked to high pollution. For Delhi, Lucknow, and Kanpur, more than half of wintertime PM2.5 was associated with air flowing in from the northwest, passing over the Thar Desert, Punjab, Haryana, and Rajasthan—regions known for dust storms and intense crop residue burning. Patna, farther east, showed a more mixed pattern, with important contributions from nearby Bihar, eastern Uttar Pradesh, and the plains of Nepal, where local burning and brick kilns are major sources.
What the findings mean for people and policy
In simple terms, the authors show that smart use of data and machine learning can turn a blurry, underestimated picture of air pollution into a much sharper and more realistic one, even in areas with few monitors. Their approach proves that combining satellite-era reanalysis, detailed weather information, and a decade of ground measurements can reliably track dangerous fine particles across the Indo-Gangetic Basin. At the same time, the air-mass analyses make clear that the dirtiest winter episodes cannot be blamed only on local traffic or factories; they are heavily shaped by regional winds that carry smoke and dust across state and national borders. This means that cleaning the air will require both local steps—such as controlling city emissions and household fuels—and broader, coordinated action to manage crop burning and dust sources across the wider region.
Citation: Singh, V., Singh, S., Sharma, N. et al. Estimation of surface PM2.5 over the Indo-Gangetic Basin using MERRA-2 reanalysis and machine learning. Sci Rep 16, 13755 (2026). https://doi.org/10.1038/s41598-026-37934-9
Keywords: air pollution, fine particulate matter, Indo-Gangetic Basin, machine learning, crop residue burning