Clear Sky Science · en
Quantifying mean, variability, and uncertainty in indoor radon exposure in Pennsylvania using random forest and quantile regression forest models
Why invisible home gas matters
Radon is a colorless, odorless radioactive gas that can seep into homes from the ground and raise the risk of lung cancer, especially for nonsmokers. Many maps show only average radon levels for large areas such as counties, which can hide dangerous hot spots from families and public health officials. This study asks a simple question with big consequences: how can we use modern data tools to see not just the average risk in a neighborhood, but also how much that risk varies from house to house?
Looking closer than county maps
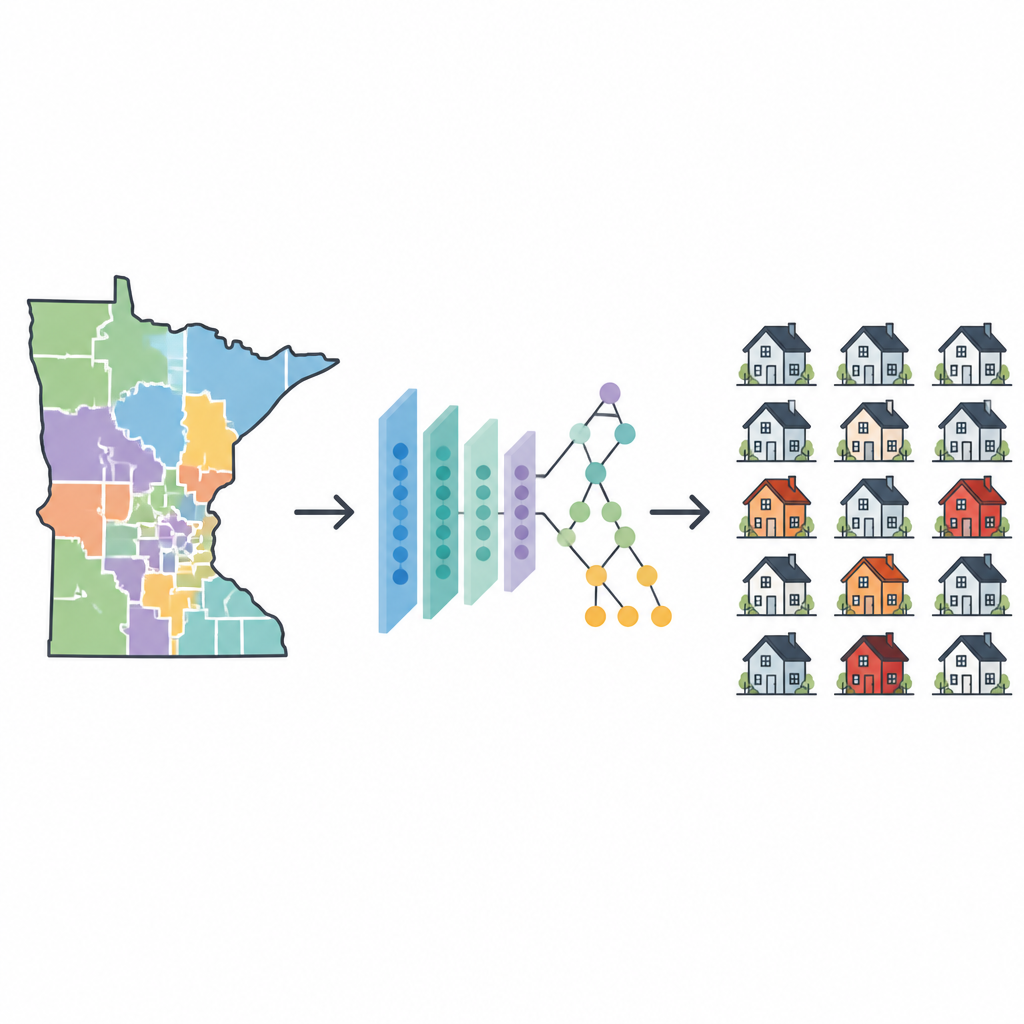
The researchers focused on Pennsylvania, a state known for high radon levels, and examined more than 1.6 million indoor radon tests collected between 2008 and 2021. After applying strict quality checks, they analyzed about 718,000 tests from over 1,500 postal code areas. Instead of stopping at county averages, they worked at the scale of zip code tabulation areas, which are closer to real communities. They combined the radon data with over 60 kinds of information about local geology, soil, water, weather, and housing, such as soil type, elevation, temperature, and how homes are heated.
How smart models read the landscape
To make sense of this rich mix of data, the team used machine learning techniques called random forest and quantile regression forest models. These methods look for patterns across many variables at once, learning how combinations of soil, rock, weather, and building traits relate to radon levels. One model estimated the typical or average radon level in each postal area. Another focused on how much radon levels vary within an area. A third model predicted not only the middle of the radon range but also the higher ends, such as the 75th and 90th percentiles, which represent homes with unusually high readings.
What shapes radon patterns in communities
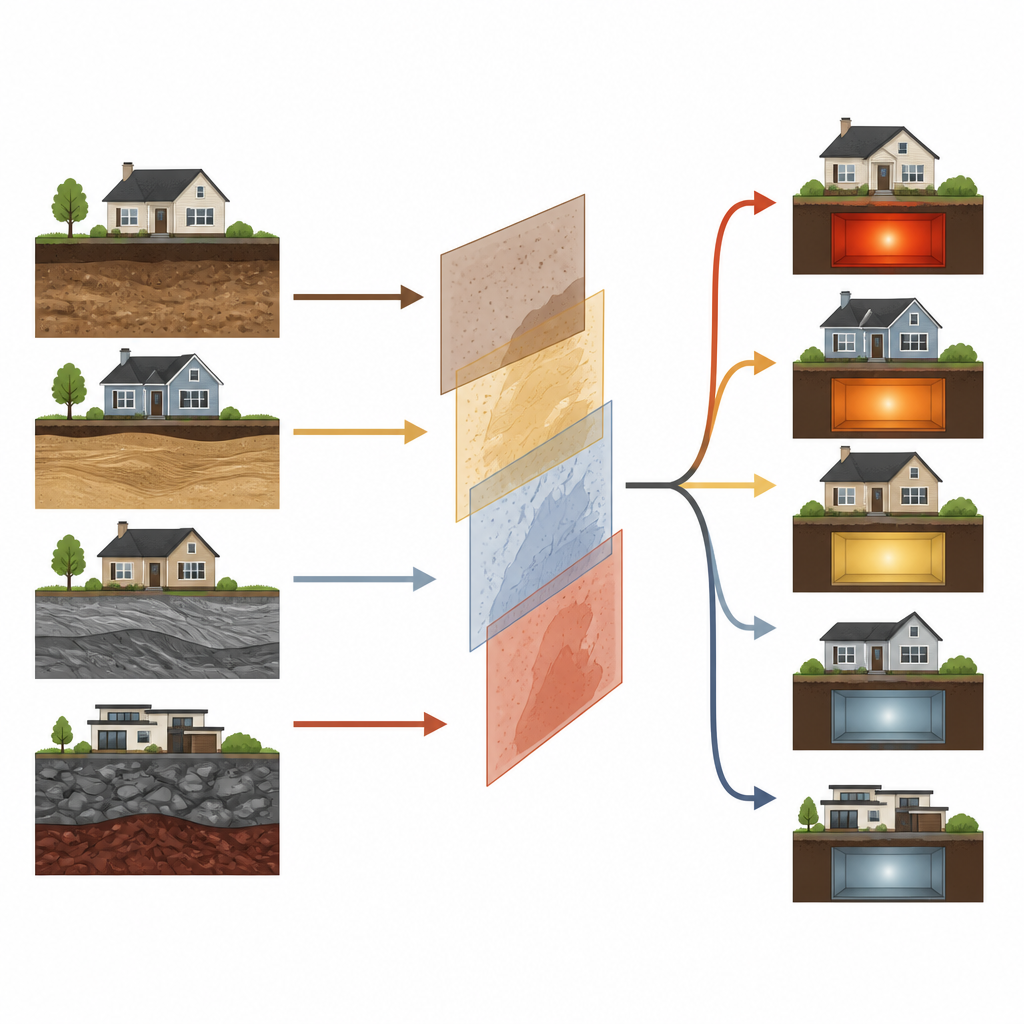
The models showed that average radon levels in a community are strongly linked to how easily gases can move through the ground, a property known as permeability, along with related features such as saturated hydraulic conductivity. Areas with more permeable soil tend to have higher average indoor radon levels. Heating fuel also mattered: places that rely more on wood, coal, or similar fuels often had higher radon, while places using utility gas tended to have lower levels, possibly because fuel type reflects differences between rural and urban housing. However, the factors that drive variation from house to house are not the same as those that raise the average. High variability was most common where elevation, soil water movement, temperature, soil drainage, and other soil traits varied a lot within the same postal area.
Hidden hot spots in “moderate” areas
Crucially, the quantile regression forest model revealed that some communities with modest average radon levels still contained many homes with very high concentrations. Even where the typical level fell below the U.S. Environmental Protection Agency action guideline, the predicted 90th percentile could be far above it. In practical terms, this means that looking only at the average for a zip code can be misleading: a neighborhood that seems safe on paper may still hide many homes with dangerous radon levels. By estimating the upper end of the radon range, the models help identify postal areas where a large share of houses are likely to exceed recommended limits and therefore deserve priority for testing and mitigation.
What this means for families and planners
For everyday residents, the main takeaway is that a low community average does not guarantee a low radon level in any individual home. For public health planners, the new modeling approach offers a way to pinpoint areas that combine high average levels and high variability, or moderate averages with extreme outliers, so they can better target testing campaigns and mitigation resources. By combining several machine learning models and fine-scale environmental data, this study shows how we can move beyond coarse county maps toward a more detailed, realistic picture of indoor radon risk, supporting smarter decisions about where to test and where to focus protection efforts.
Citation: Lee, H., Maguire, D., Logan, J. et al. Quantifying mean, variability, and uncertainty in indoor radon exposure in Pennsylvania using random forest and quantile regression forest models. Sci Rep 16, 15192 (2026). https://doi.org/10.1038/s41598-026-37891-3
Keywords: indoor radon, environmental health, machine learning, geospatial mapping, lung cancer risk