Clear Sky Science · en
Trend prediction method for capacitive voltage transformer measurement deterioration based on double Gaussian model-KAN fusion
Why keeping an eye on grid “thermometers” matters
Modern power grids rely on special devices that step extremely high voltages down to safer levels so they can be measured and billed. Among these, capacitive voltage transformers (CVTs) are the workhorses of high‑voltage lines. Over years of service, however, their readings can quietly drift, much like a bathroom scale that slowly goes out of calibration. This paper introduces a new way to continuously judge how healthy a CVT’s measurements are and to forecast when its accuracy will slip, helping grid operators plan maintenance before errors lead to costly disputes or stability problems.
How these voltage watchers slowly lose their edge
CVTs use stacks of capacitors and a transformer to tame hundreds of kilovolts into signals that meters and protection systems can handle. Their appeal is that they are compact, relatively inexpensive, and well suited for ultra‑high voltages. But their innards are not static: temperature swings, aging insulation, and changing loads all nudge internal components away from their ideal values. When this happens, the ratio between the true grid voltage and the reported low‑voltage output drifts. If the ratio error grows beyond a narrow tolerance, readings no longer match reality, undermining energy trading, fault analysis, and automatic protection schemes.
Why traditional checks are not enough
Today, many utilities still rely on periodic offline checks. Heavy reference equipment is brought to a substation, lines are briefly taken out of service, and each CVT is tested against a standard. In theory this should happen every few years; in practice it is often delayed by scheduling conflicts and the logistics of moving bulky instruments. Meanwhile, the grid’s live data streams are noisy and influenced by ever‑changing operating conditions, making it difficult to see a slow measurement drift by eye or with simple statistics. Earlier approaches based on detailed circuit models or generic machine learning often struggled either because they needed precise internal parameters, or because they were confused by fluctuations and limited training data.
A single health score for each transformer
To cut through this clutter, the authors first compress each CVT’s raw voltage signal into a compact performance score they call the State of Performance (SOP). They apply a wavelet transform, a mathematical tool that separates a signal into slowly varying trends and fast wiggles. By focusing on the largest low‑frequency component and comparing it to a baseline from a healthy CVT, they obtain a single number that falls steadily as the device deteriorates. In laboratory tests where the team deliberately increased the ratio error of one phase while holding the others near normal, the SOP curve dropped smoothly as the error grew, showing that this index tracks long‑term degradation while filtering out much of the random noise. 
Splitting smooth drift from jitter
Even this health score is not perfectly smooth: grid conditions and measurement imperfections still add bumps and ripples. The researchers therefore apply a second decomposition method that teases the SOP curve apart into a slowly changing “backbone” plus a set of small, choppy components. The backbone captures the overall downward march of accuracy, while the fluctuating pieces describe short‑term ups and downs. This separation allows the team to tailor different prediction tools to different behaviors instead of forcing one model to handle everything at once.
Two smart tools working together
For the smooth backbone, the authors use a double Gaussian model—a flexible curve built from the sum of two bell‑shaped profiles—to follow subtle changes in how the CVT drifts over time, especially when the pattern is not purely linear. For the jittery components, they employ a newer type of neural network called a Kolmogorov–Arnold network (KAN). Unlike standard deep‑learning models, KAN uses adjustable curve segments as its building blocks, which helps it learn complex patterns from relatively few examples without overfitting. Trained on carefully designed degradation experiments using a three‑phase online test system, the combined approach reconstructs future SOP values by adding the double‑Gaussian backbone and the KAN‑predicted fluctuations. 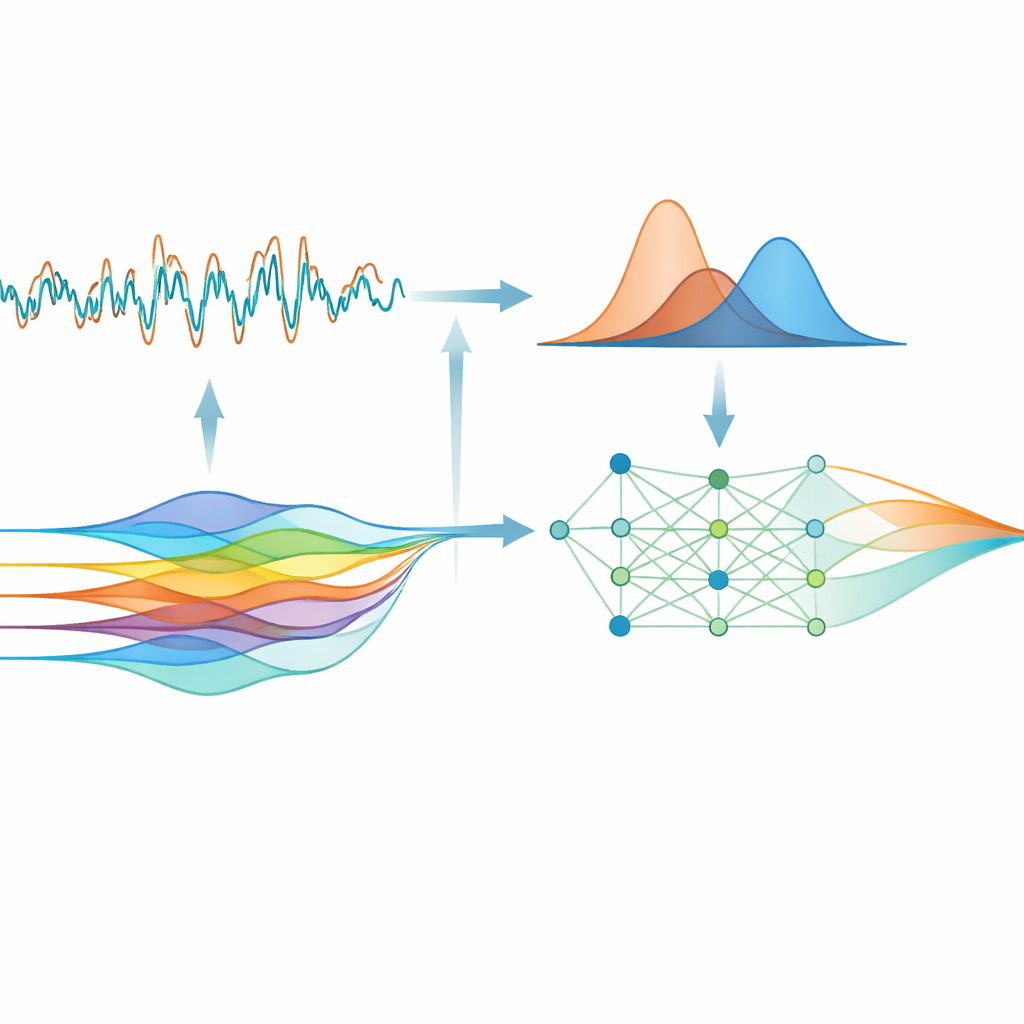
What this means for a smarter grid
In head‑to‑head tests, the fusion of the double Gaussian model and KAN consistently predicted CVT health more accurately than classic neural networks and other machine‑learning techniques. Errors between predicted and actual SOP values were small, and the method captured both the long‑term slide in accuracy and the finer‑scale wiggles. For grid operators, this translates into an early‑warning gauge: instead of waiting for a scheduled outage or a billing dispute to reveal that a transformer has drifted, they could monitor SOP trends in real time and schedule maintenance when a device is clearly on a downward path. As power systems become more automated and data‑driven, such intelligent monitoring of the grid’s own measuring instruments is a key step toward reliable, self‑aware infrastructure.
Citation: Du, B., Diao, Y., Zhou, F. et al. Trend prediction method for capacitive voltage transformer measurement deterioration based on double Gaussian model-KAN fusion. Sci Rep 16, 11785 (2026). https://doi.org/10.1038/s41598-026-35455-z
Keywords: capacitive voltage transformer, condition monitoring, predictive maintenance, time series prediction, power grid metering