Clear Sky Science · en
Improved ecological risk assessment of phenol in sediments via species sensitivity distribution and equilibrium partitioning method using water toxicity data
Why this hidden pollution matters
Many rivers and lakes around the world quietly carry a chemical called phenol, used in plastics, resins, and other products. Phenol dissolves easily in water and can linger for long periods, eventually settling into the mud at the bottom. That mud, or sediment, is home to worms, insect larvae, young amphibians, and fish that form the base of aquatic food webs. Yet scientists have had few reliable ways to judge how risky phenol in sediments really is. This study tackles that gap by building a clearer, more realistic way to estimate risk to bottom-dwelling life, even when direct sediment tests are scarce.
From factory pipe to riverbed life
When phenol enters rivers, it does not stay only in the flowing water. Some of it attaches to tiny particles and sinks into the sediment, where many species live or feed. Regulators need a safe limit for phenol in this muddy layer, called a predicted no-effect concentration, to decide when cleanup or stricter controls are needed. Previous attempts produced wildly different safe levels because they drew on small datasets, relied on big safety factors, and often focused on water-dwelling species rather than the creatures that actually live in or on the sediment.
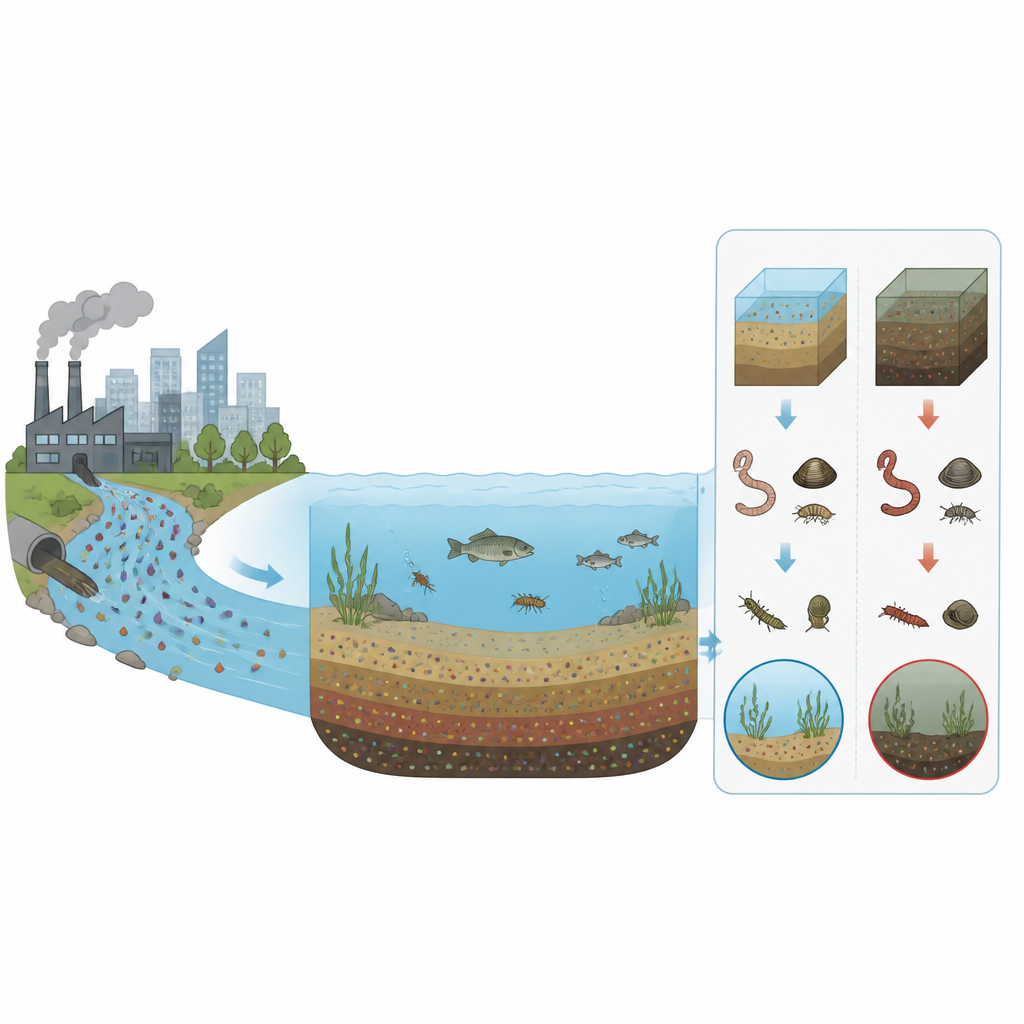
Turning water data into sediment answers
The researchers combined two established ideas into one framework. First, they used an equilibrium partitioning method, which estimates how much phenol in water would end up in sediments under typical conditions. Second, they built what is known as a species sensitivity distribution, a curve that shows how sensitive many different species are to phenol. To feed this curve, they gathered acute and long-term toxicity data from both standard lab tests and more natural artificial stream experiments. They converted water-based effect levels into sediment-equivalent values and then used statistical models to find a concentration that would protect most species in the community.
Who is most at risk in the mud
By comparing many species, the team could see which groups are most easily harmed. Bottom-dwelling organisms, including worms, insect larvae, and early stages of amphibians, turned out to be more sensitive than species that mostly swim in open water. Amphibian eggs and larvae in particular sat at the most fragile end of the sensitivity curve and strongly influenced the protective limit. Still, differences across species groups were usually less than tenfold, suggesting that commonly tested organisms such as small crustaceans can still offer a generally protective picture if they are combined with a diverse set of other species.
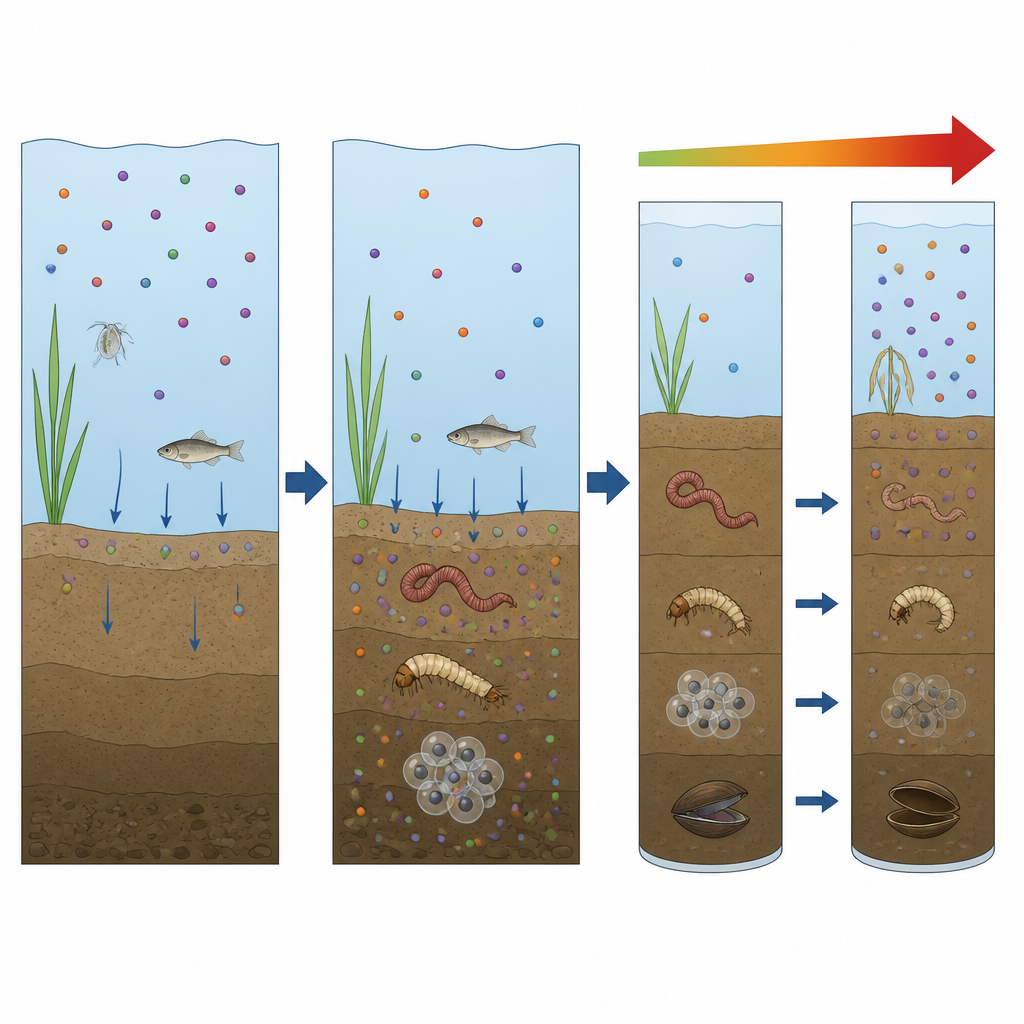
How much data is enough
The study also asked how many species are needed to build a stable picture of risk. Using repeated sampling of their dataset, the authors showed that when only a few species are included, the model tends to underestimate danger. As more species are added, the estimated safe level drops and then levels off. Once data from at least eight species were included, additional information did not change the result much. This finding gives regulators a practical rule of thumb for future studies: for phenol-like chemicals, a sensitivity curve based on about eight or more well-tested species can provide a reliable basis for decisions.
What this means for real rivers
Using their combined method, the researchers arrived at a suggested safe level for phenol in sediments of 0.81 micrograms per gram of dry sediment. They then compared this value with measured phenol levels reported from 23 sites worldwide, including industrial rivers, estuaries, and mangroves. About 70 percent of the sites exceeded the safe level by enough to be labeled high risk for sediment organisms, and another 17 percent fell into a moderate risk range. Even though the new approach is less extreme than some older methods, it still flags most monitored locations as places where bottom-dwelling life may be under stress.
Take-home message for the environment
For non-specialists, the key message is that a large share of phenol-contaminated sediments already pose a concern for the animals that live in them. The study shows that it is possible to build a clearer and more realistic safety threshold using existing water toxicity data, careful modeling of how chemicals move between water and mud, and a broad view of species sensitivity. While the method still needs to be checked against direct sediment tests, it offers a practical way to guide cleanup and pollution control in the many places where phenol and similar chemicals collect out of sight on the river and lake floor.
Citation: Park, S., Lee, SJ., Park, JW. et al. Improved ecological risk assessment of phenol in sediments via species sensitivity distribution and equilibrium partitioning method using water toxicity data. Sci Rep 16, 15677 (2026). https://doi.org/10.1038/s41598-025-32928-5
Keywords: phenol, sediment pollution, aquatic toxicity, species sensitivity distribution, ecological risk assessment