Clear Sky Science · en
Truck Travel times on freeway facilities and segments in Germany based on FCD from 2019
Why Truck Travel Time Matters
Every online order, supermarket shelf, and factory line depends on trucks arriving when expected. Yet anyone who has sat in a highway jam knows that travel times can be wildly unpredictable—especially for heavy trucks that are limited to lower speeds and cannot easily make up delays. This study tackles that everyday problem at a national scale: it builds detailed, data-driven truck travel times for Germany’s freeway network, using billions of real movements from connected vehicles to reveal when and where freight is likely to be delayed.
Following Real Trucks on the Road
Instead of relying on sparse roadside sensors, the researchers use so‑called floating car data—signals sent by in‑vehicle navigation systems and onboard units that record position, time, and speed. For 2019 alone, Germany’s automobile club collected more than 25 billion such data points from vehicles traveling on motorways. These raw signals are first linked to a digital map of the highway system built from open mapping data. A specialized routing engine snaps each GPS point to the most likely road segment, taking into account the vehicle’s direction and the structure of the network. This step turns a cloud of anonymous dots into precise paths along 100‑meter‑long pieces of road.
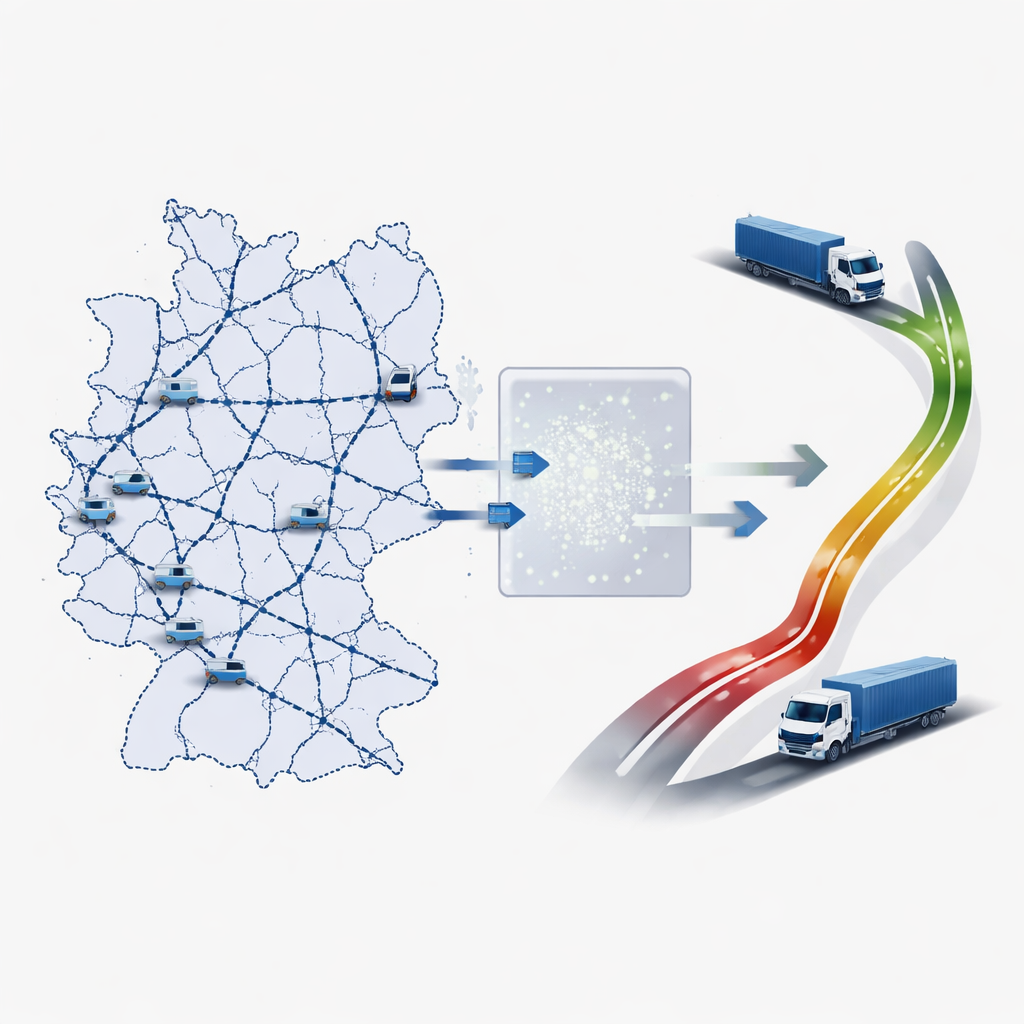
Separating Trucks from Cars
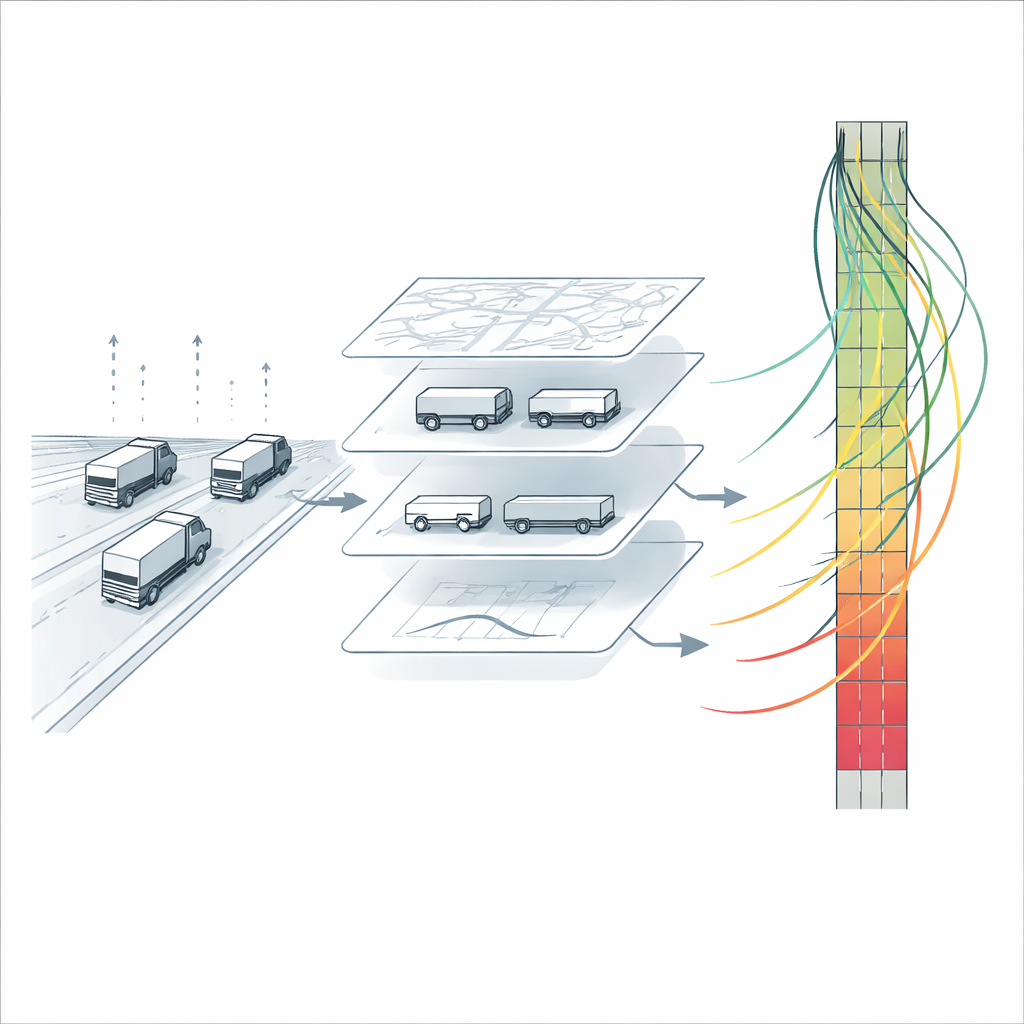
Because the signals come from many kinds of vehicles, the next challenge is to identify which ones are heavy trucks. The authors build a database that describes how fast each anonymous vehicle typically travels on different kinds of roads. When they plot these speeds, two clear groups appear: slower vehicles that rarely exceed typical truck speeds, and faster ones more consistent with passenger cars. Rather than simply cutting the data into two groups, the team uses a clustering method that creates three speed-based groups. The extra middle group helps capture vehicles in mixed or congested conditions that might otherwise be misidentified as trucks, trading some sample size for cleaner, more reliable truck data.
From Scattered Readings to a Continuous Picture
Even with millions of observations, the data do not cover every truck on every stretch of road at every minute. To gauge how representative the sample is, the researchers compare it to official counting stations that record traffic volumes and speeds. They find that their data represent roughly 6% of trucks on average, which is enough to describe overall conditions, especially when speeds are averaged over several minutes. To fill the remaining gaps, they apply a smoothing method widely used in traffic research that blends nearby observations in space and time. This produces a continuous picture of how speeds evolve along each freeway, revealing, for instance, long midday congestion zones where truck speeds drop sharply before recovering later in the day.
Building Dynamic Travel Time Tables
Armed with these continuous speed fields, the authors compute how long a truck would take to traverse each freeway segment at different departure times. They divide every facility into short 100‑meter elements and simulate a truck moving from one element to the next, updating the assumed speed every ten minutes to reflect the latest traffic conditions. In this way, a trip that starts before a jam might pass through the congested area quickly, while one leaving later accumulates growing delay. When the resulting travel times are compared with those measured directly from individual truck trips in the data, the differences are usually just a few seconds, with larger errors confined to a small number of unusual cases.
What This Means for Everyday Logistics
The outcome of this work is a freely available set of detailed truck travel times for Germany’s motorways, broken down by freeway and segment in ten‑minute steps throughout typical weekdays. For shippers, carriers, and planners, these data turn the vague risk of delay into concrete numbers that can be built into schedules, routing software, and capacity plans. For the general public, it means that the same connected vehicles already on the road can quietly provide the information needed to run supply chains more reliably—helping goods arrive on time, reducing wasted fuel, and making better use of existing highway infrastructure without laying a single new sensor in the ground.
Citation: Schlott, M., Abdul, L. & Leerkamp, B. Truck Travel times on freeway facilities and segments in Germany based on FCD from 2019. Sci Data 13, 588 (2026). https://doi.org/10.1038/s41597-026-07198-z
Keywords: truck travel time, highway congestion, floating car data, freight logistics, traffic reliability