Clear Sky Science · en
Comprehensive UAV and ground data for typical semiarid sites in the midstream of the Heihe River Basin
Watching Drylands from Above
Dry and semidry regions around the world struggle with scarce water, fragile soils, and fast changing landscapes. Farmers, water managers, and ecologists all need better ways to see how fields, deserts, and wetlands warm up, cool down, and grow over time. This article introduces a rich collection of drone and ground measurements from a river basin in northwestern China that lets scientists zoom in on these changes at the level of individual fields and shrubs, while still linking them to satellite views from space.
Three Contrasting Landscapes
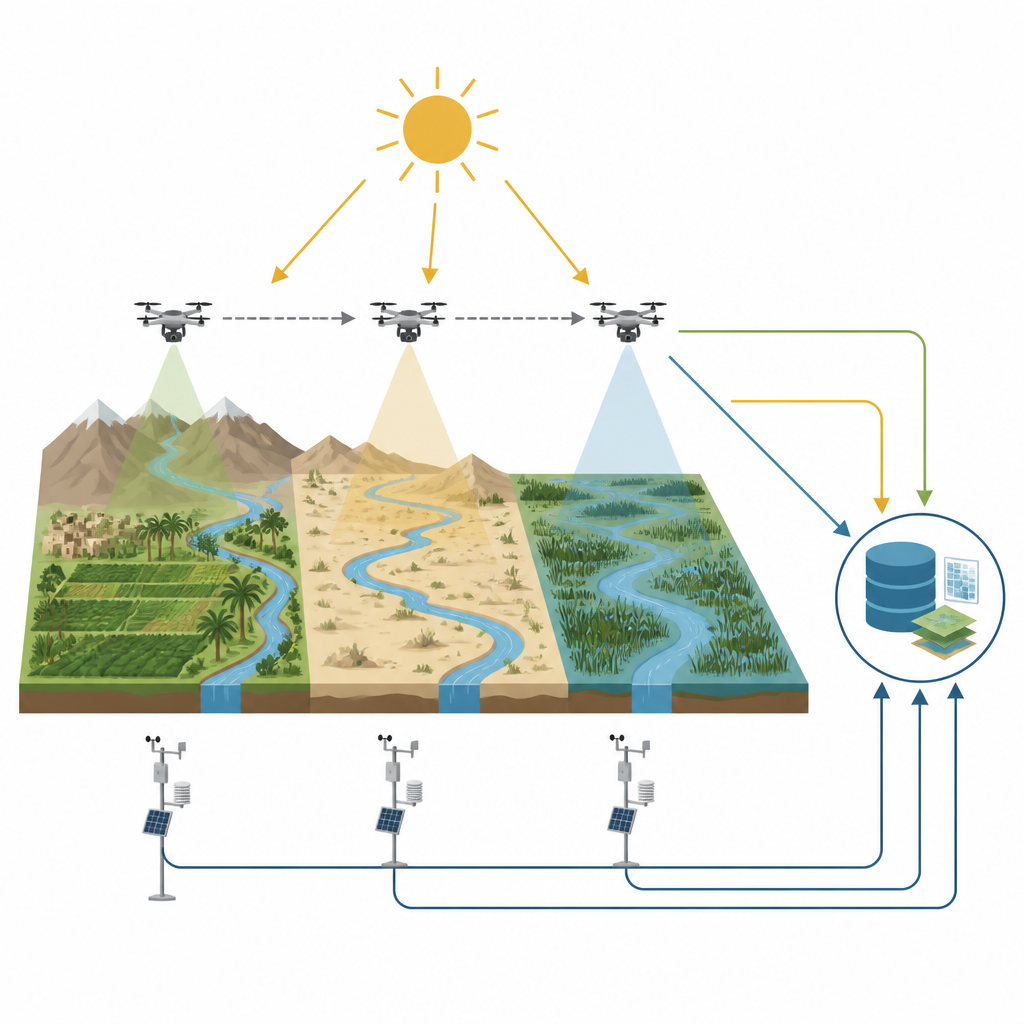
The study focuses on the middle reaches of the Heihe River Basin, a classic oasis in the desert where snow and ice from distant mountains feed farmland, bare sand, and reed-filled marshes. Researchers chose three representative areas: an irrigated farming oasis called Daman, a sparsely vegetated desert called Huazhaizi, and a reed wetland simply called Wetland. Each area covers a few square kilometers, roughly matching the footprint of common satellite pixels while also enclosing tall towers that track energy and gases moving between land and air. Together, these three sites capture the range of conditions that shape how dryland ecosystems behave.
Drones as Flexible Flying Cameras
To watch these landscapes in detail, the team flew a large multicopter drone equipped with two special cameras. One camera senses heat, recording how warm the surface is in the thermal infrared part of the spectrum. The other is a multispectral camera that takes images in five narrow color bands that are particularly sensitive to plant health. Flying at about 300 meters height, the drone produced images with pixels just a few tens of centimeters across, fine enough to pick out irrigation ditches, narrow roads, and small patches of grass. Flights were repeated from June to October 2020, covering the full growing season from early green-up to post-harvest stubble.
Ground Stations as Truth Checkers
While the drones crisscrossed the sky, ground instruments ran continuously. At each site, tall towers measured wind, air temperature and humidity, sunlight coming down and heat going back up, along with exchanges of water vapor and carbon dioxide. Additional infrared sensors pointed at specific surfaces such as cornfields, roads, bare soil, reeds, and even the sky, recording their brightness temperature every few seconds. These measurements serve as a reference to check and fine tune the drone based maps, helping to correct for sensor drift, changing weather, and other quirks that can distort airborne readings.
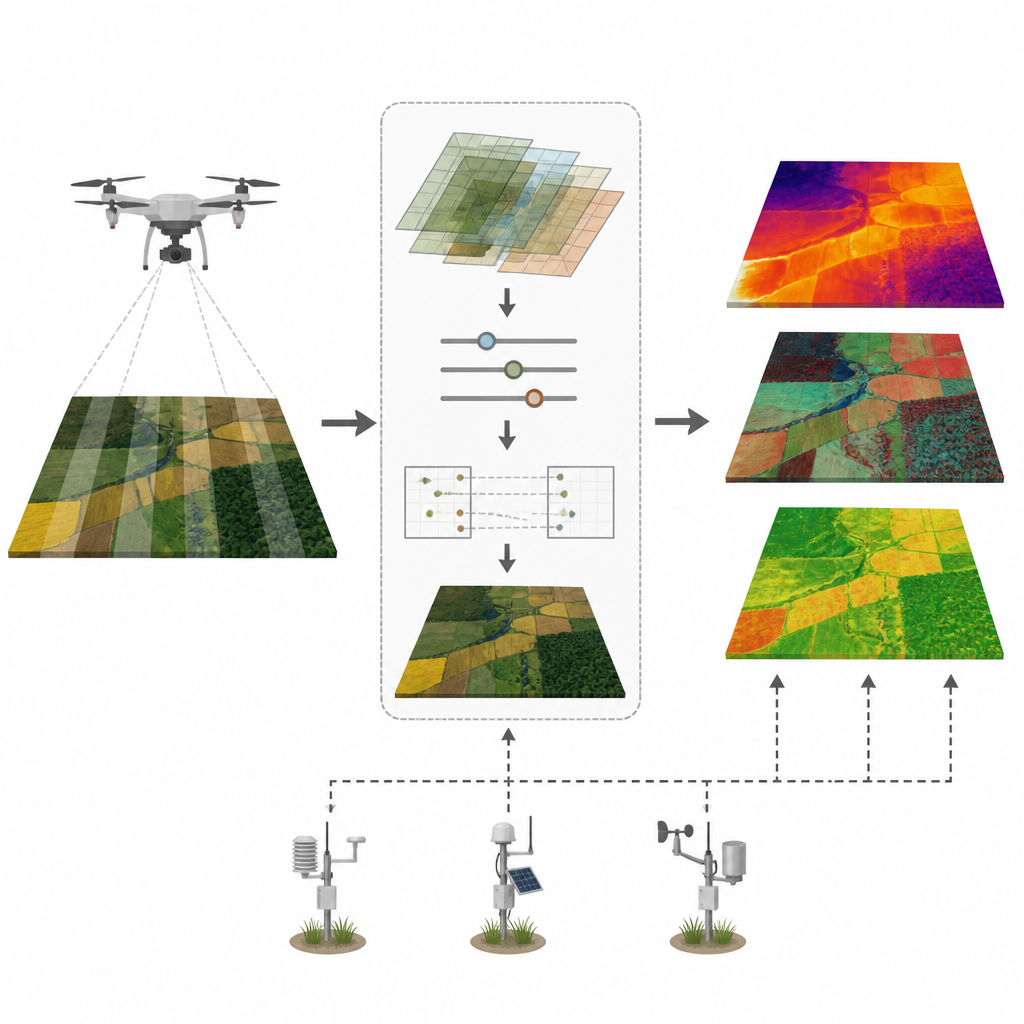
Turning Raw Images into Clean Maps
Raw heat images from small thermal cameras are notoriously fickle, drifting as the device warms or cools during flight, which can create stripes and false hot or cold spots. The researchers developed a method that looks at how pixel values are distributed in each frame and uses a carefully chosen reference image plus physical simulations to remove these drifts. Afterward, they stitched the corrected frames into smooth, georeferenced heat mosaics, then further calibrated them using the ground infrared sensors. Multispectral images faced a different problem: each battery powered flight segment produced separate tiles with slightly mismatched brightness. By matching overlapping features between tiles and using simple linear corrections, the team brought all segments into line before stitching, greatly reducing visible seams and color jumps.
Maps that Reveal Plant Life
From the cleaned multispectral mosaics the team computed a vegetation index that highlights where plants are thriving or fading. They showed that, without their brightness corrections, these maps contained artificial bands and unrealistic patches that could mislead anyone trying to track crops or restoration efforts. With the corrections in place, the maps matched the real scene: low values over post harvest fields, extremely low values over the desert with scattered shrubs, and moderate to high values in parts of the wetland where reeds and grasses remained green. Combined with the tower data, the full set lets researchers relate plant cover and surface warmth to radiation, wind, and moisture over days to months.
A New Testbed for Dryland Research
In the end, this work does not present a single result so much as a toolbox and a shared reference. It delivers open access, very high resolution heat maps, color band mosaics, vegetation maps, and matching tower records for three contrasting dryland sites. Because everything is carefully aligned in space and time, the data can be used to test satellite products, train new computer models, explore how heat and moisture flow through mosaics of fields and dunes, and support precision farming and restoration planning. For anyone interested in how water, plants, and climate interact in dry regions, this dataset acts as a detailed, trustworthy snapshot of a living landscape.
Citation: Zhou, J., Wang, Z., Liu, S. et al. Comprehensive UAV and ground data for typical semiarid sites in the midstream of the Heihe River Basin. Sci Data 13, 785 (2026). https://doi.org/10.1038/s41597-026-07151-0
Keywords: UAV remote sensing, land surface temperature, NDVI, semiarid ecosystems, Heihe River Basin