Clear Sky Science · en
Integrated single-cell transcriptomic atlas of human gastric and colorectal tissues across diverse phenotypes
Why this matters for gut health
Cancers of the stomach and colon are among the leading causes of cancer death worldwide, yet the tissues that give rise to these diseases are astonishingly complex. Each tumor is a bustling community of many cell types that can support or suppress cancer growth. This study offers one of the largest, most detailed maps so far of individual cells from human stomach and colorectal tissues, across healthy, inflamed, and cancerous states. By laying this map open to researchers everywhere, the work provides a new starting point for understanding why some people develop cancer, why some treatments work better than others, and how future therapies might be tailored more precisely.
Building a detailed cellular map
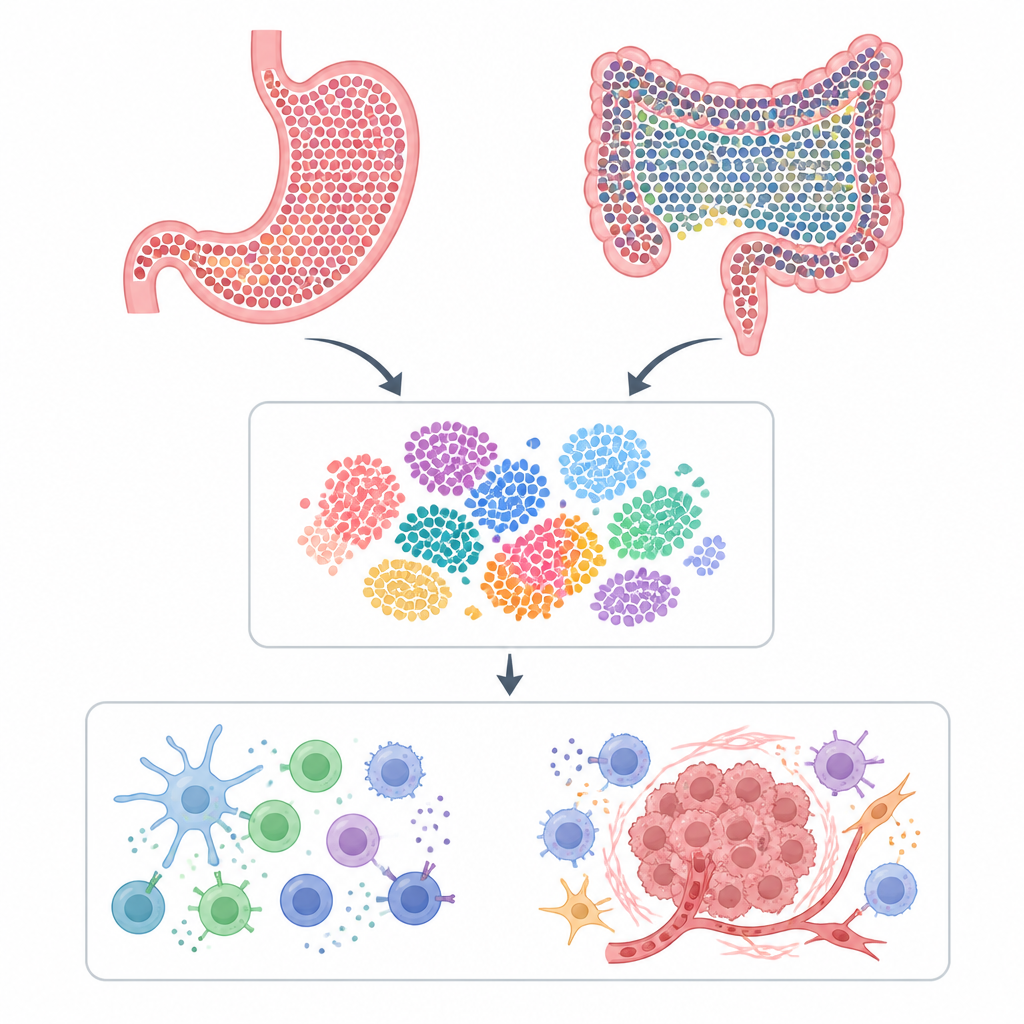
The authors gathered raw single-cell RNA sequencing data, a technology that reads which genes are active in thousands of individual cells at once. They systematically searched public databases for human stomach and colorectal datasets that covered many kinds of cells, rather than focusing on a single cell type. In total, they compiled data from 229 stomach samples and 220 colorectal samples, drawn from many independent studies and covering a wide spectrum of clinical situations, from normal tissue and various forms of inflammation to primary tumors and multiple metastatic sites.
From noisy measurements to clean data
Because different research groups used different instruments and protocols, the combined data were initially inconsistent and noisy. The team applied strict quality control rules to remove damaged or low-quality cells, discarding cells with too few or too many detected genes or with signs of cellular stress. They then benchmarked several popular computational methods for merging datasets, asking which one best removed technical differences while preserving real biological patterns. A tool called Harmony emerged as the best compromise, producing integrated maps in which cells grouped according to their true identity and disease state rather than the study they came from.
Who is in the gut neighborhood
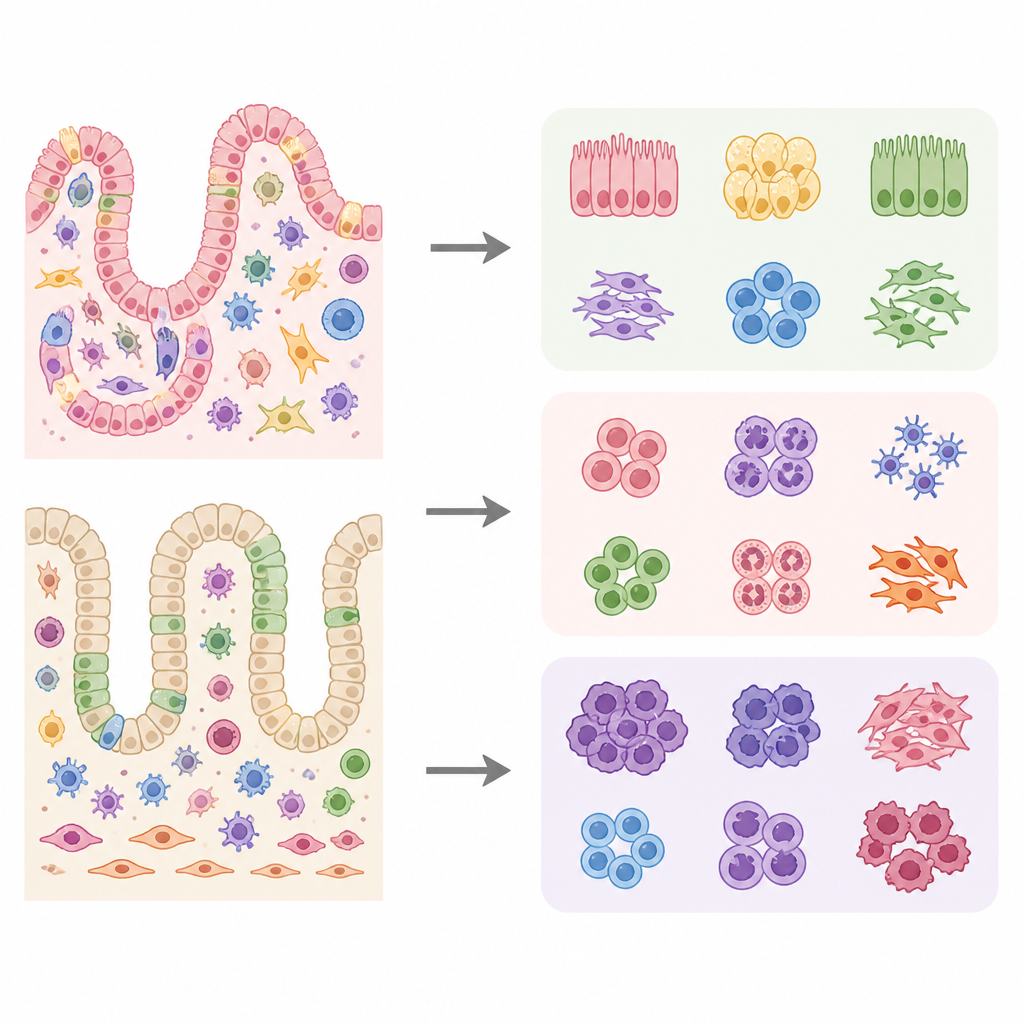
After integration, the researchers identified 70 distinct cell types in both stomach and colorectal tissues. Broadly, these included epithelial cells that line the gut, fibroblasts and other stromal cells that form structural support, blood vessel cells, many immune cell varieties, and specialized glial cells in the colon. Within these broad families, they distinguished fine-grained subtypes using known marker genes. For example, they separated multiple epithelial lineages such as goblet cells, enterocytes, and specialized colonocytes, as well as many flavors of fibroblasts and blood vessel cells that shape the local environment and may influence how tumors grow and spread.
Immune cells in health, inflammation, and cancer
The atlas sheds light on how immune cell communities shift as tissues move from health to inflammation to cancer. In the stomach, certain macrophage subtypes associated with immune checkpoints and tumor promotion were more common in cancer and metastatic samples, while mast cells declined. In the colon, normal tissue was rich in resident macrophages linked to tissue stability, but tumor tissue showed more macrophages known to support cancer progression and a rise in neutrophils. Detailed mapping of T cell and B cell subtypes, including exhausted T cells and antibody-producing plasma cells, revealed patterns consistent with poorer outcomes and chronic inflammation, such as the loss of protective IgA-producing cells near tumors and an increase in IgG-producing cells in ulcerative colitis.
Following cells along their life paths
To check that their cell labels reflected real biology, the team used computational methods to order T cells along likely developmental paths, from naïve cells toward memory and exhausted states. These trajectories matched established models for both CD4 and CD8 T cells in the stomach and colon, reinforcing confidence in the annotations. Together with careful checks of cell proportions across different disease stages and sample sources, this validation shows that the atlas captures both the diversity of cell types and their expected behavior as disease progresses.
What this resource means for the future
Rather than proposing a single new treatment, this work delivers a shared reference that many researchers can use. By offering a harmonized, well-annotated atlas of more than a million individual cells from stomach and colorectal tissues, along with associated clinical information and open code, the study makes it easier to compare findings across diseases and centers. In plain terms, it functions like a high-resolution street map of gut tissues, revealing where different cell types live and how they change with inflammation and cancer. This map can guide future efforts to find common weak points in gastrointestinal cancers and to design therapies that act on specific cell communities within the tumor microenvironment.
Citation: Go, Y., Uesugi, A., Lee, D. et al. Integrated single-cell transcriptomic atlas of human gastric and colorectal tissues across diverse phenotypes. Sci Data 13, 751 (2026). https://doi.org/10.1038/s41597-026-07108-3
Keywords: single-cell atlas, gastric cancer, colorectal cancer, tumor microenvironment, gut inflammation