Clear Sky Science · en
Automated 10-m Resolution In-season Crop-type Data Layer Mapping for Contiguous United States
Why fast crop maps matter
Each summer, millions of acres of corn, soybeans, cotton, and other crops shape the price of food and fuel in the United States and beyond. Yet the most widely used national crop map is typically released months after harvest, which is too late for many real time decisions. This study presents a way to map what is growing where across the contiguous United States during the season itself, at a detail fine enough to see individual fields and with only a few days of delay.
A new kind of in season crop map
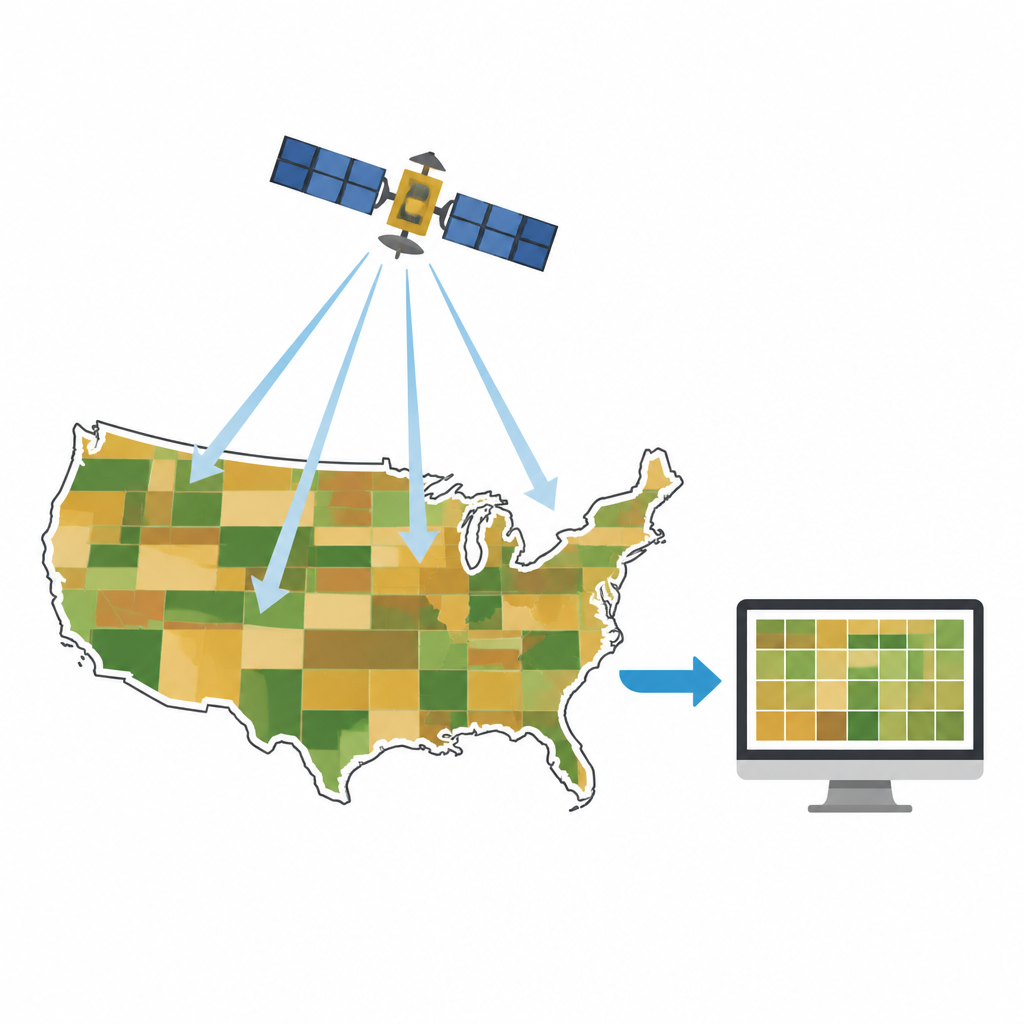
The authors introduce the In season Crop type Data Layer, or ICDL, a set of monthly maps that show crop types at 10 meter resolution across the lower 48 states. Unlike traditional products that appear the following year, these maps for June, July, and August are made public only about five days after the end of each month. That speed allows farmers, companies, and agencies to track planted area, monitor risks, and plan logistics while crops are still in the ground. The ICDL is delivered in a standard map format and can be viewed online through the CropSmart web portal or downloaded for independent analysis.
Reading the land from space
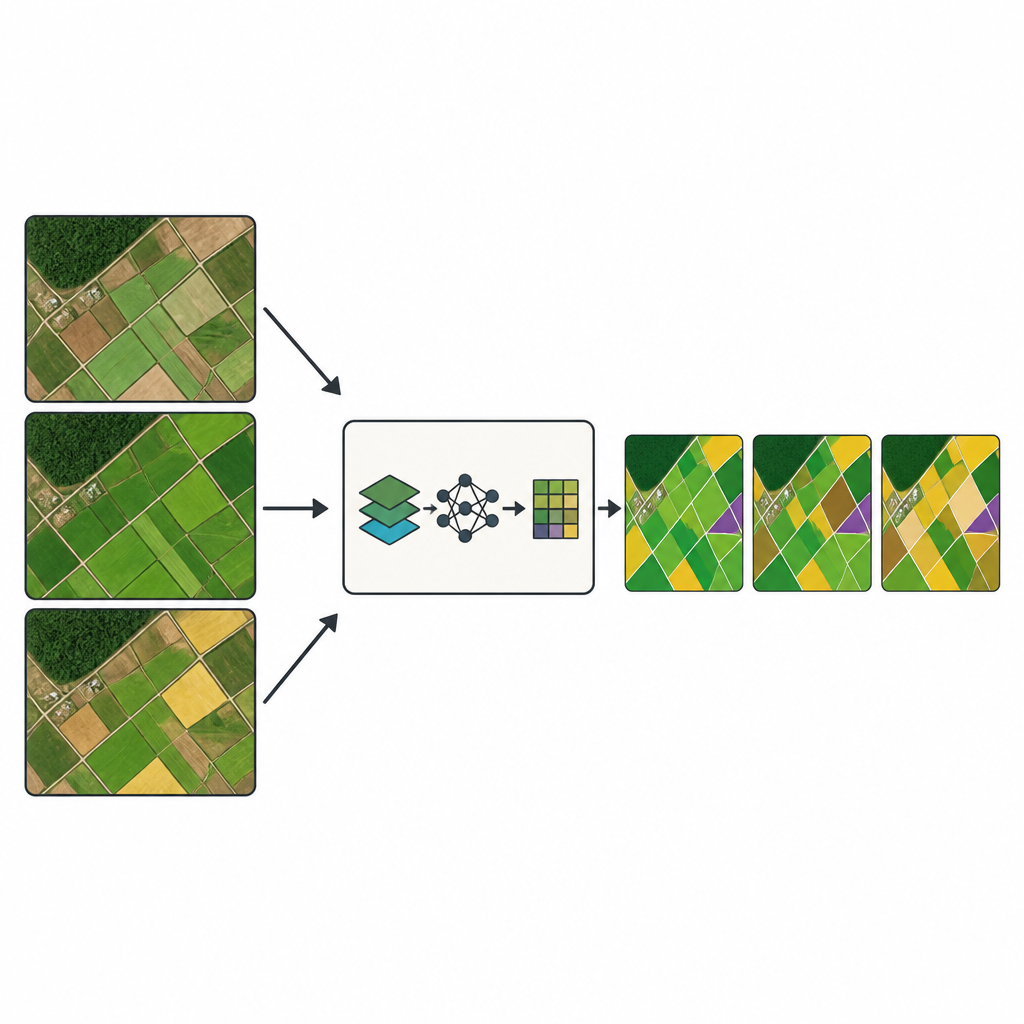
To build these timely maps, the team relies on a steady flow of images from two satellite programs, Sentinel 2 from Europe and Landsat 8 and 9 from the United States. These satellites repeatedly photograph the same fields in several colors of light that are sensitive to leaf growth and water, capturing how crops emerge, grow, and mature from late spring through summer. The method also taps into years of past U.S. crop maps to learn where particular crops tend to repeat in the same fields or alternate in simple patterns, such as corn and soybeans switching year to year. Pixels that follow such stable patterns serve as trusted examples of each crop for training the mapping system.
Turning image time series into field level maps
For each satellite scene that covers part of the country, the researchers combine trusted training pixels with stacks of images collected from May through each summer month. They process these data to standardize resolution and compute simple indicators of plant vigor and water. A machine learning method called a random forest then learns how the changing satellite signals correspond to different land covers, including major crops and other classes like pasture or forest. Separate maps are created from the Sentinel and Landsat streams, then stitched together into national layers, with Sentinel given priority because of its finer detail. A final clean up step smooths out isolated misclassified pixels to sharpen field boundaries.
How accurate are the maps
The team carefully checked the ICDL by comparing it with field observations collected in Nebraska and Iowa and with official state level crop area statistics. At the pixel level, accuracy improves as crops develop, rising from around 81 percent in June to about 93 to 98 percent in August, and often surpassing the long standing Cropland Data Layer in late summer. The method performs especially well for corn and soybeans in the Corn Belt. When ICDL based acreage estimates are compared with official totals for corn, soybeans, and cotton, differences are usually within a few percent for most states, and overall regional totals are very close to reported values.
What this means for food and land management
For planners, analysts, and scientists, the ICDL offers a timely, nationwide picture of what farmers are growing, down to individual fields, during the season instead of long after it ends. While the authors note that performance can vary by crop, region, and image quality, the maps consistently reach high accuracy and track official statistics closely. This new data layer can strengthen yield forecasts, supply and demand estimates, and risk assessments for drought or market shocks, helping decision makers respond more quickly to changes in the farm landscape.
Citation: Li, H., Di, L., Zhang, C. et al. Automated 10-m Resolution In-season Crop-type Data Layer Mapping for Contiguous United States. Sci Data 13, 750 (2026). https://doi.org/10.1038/s41597-026-07099-1
Keywords: crop mapping, satellite imagery, agricultural monitoring, remote sensing, United States crops