Clear Sky Science · en
A 30 m Multi-Year Dataset of Major Crop Distributions in Xinjiang, China (2013–2024) Based on Harmonized Landsat–Sentinel-2 Data
Why mapping crops from space matters
Feeding a growing population in a warming, drying world depends on knowing what is planted where and how it changes over time. In Xinjiang, a vast and mostly arid region in western China that produces much of the country’s cotton and grain, this basic information has been surprisingly hard to obtain. The study described here turns years of satellite images into a detailed map of major crops across Xinjiang, giving farmers, planners, and scientists a new window onto how this dryland breadbasket is managed.
A dryland region with big farming ambitions
Xinjiang covers an area about one sixth the size of China, framed by high mountains and desert basins. Most farming takes place in green oases fed by rivers and irrigation canals, where cotton, maize, wheat, rice, and orchards dominate. National policies and water saving technologies have helped make Xinjiang China’s largest cotton producer, while its grains are vital for regional food supply. Yet the same mountains, deserts, and scattered fields that make the landscape striking also make it difficult to monitor using traditional surveys alone. Until now, available maps tended to cover only a single crop, a few years, or relatively coarse detail.
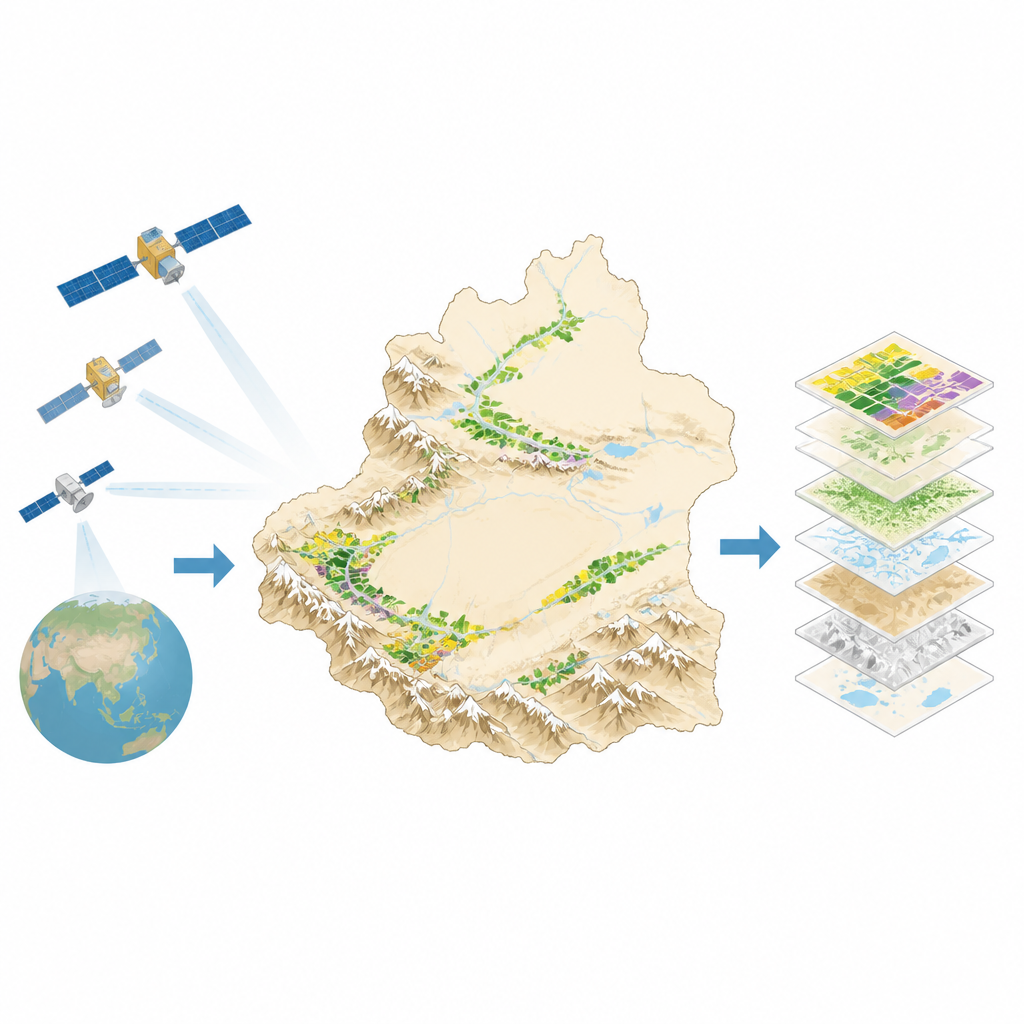
Turning satellite snapshots into a yearly crop atlas
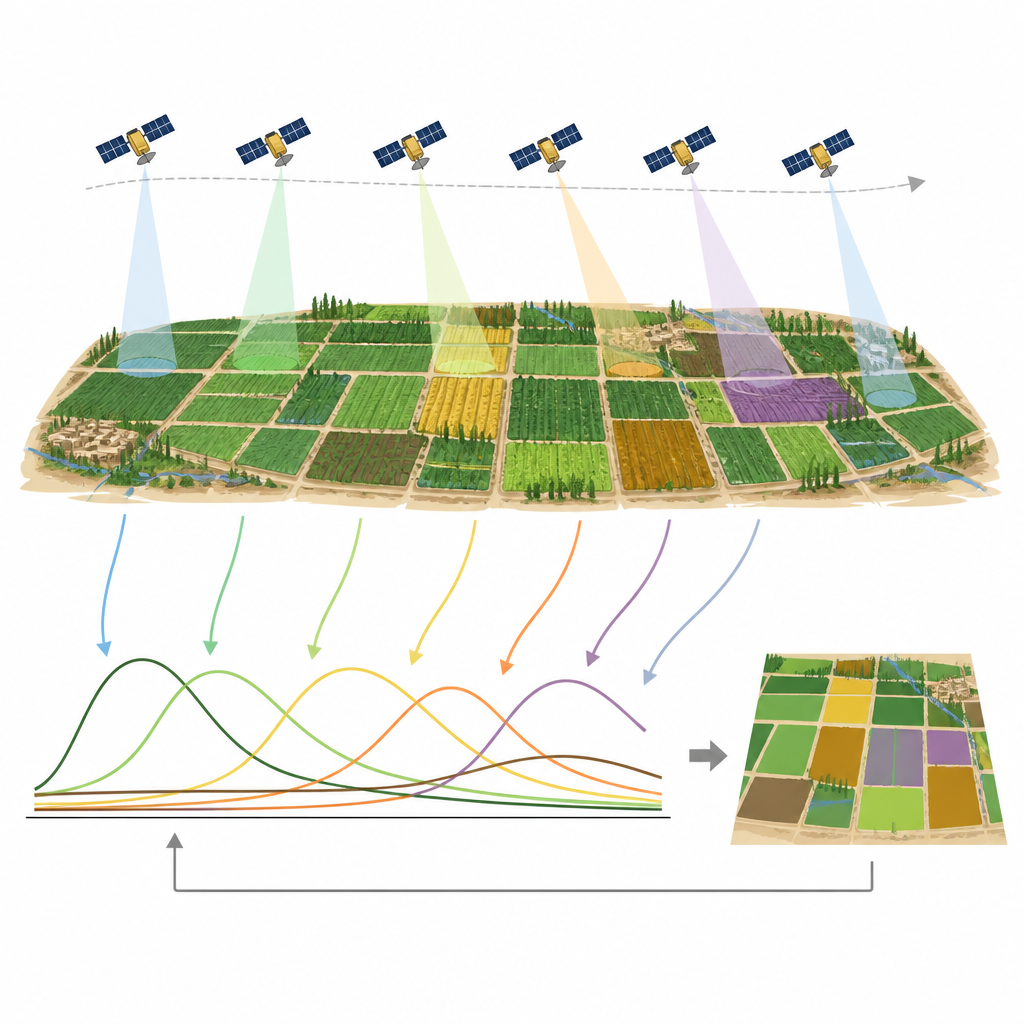
The researchers built a new mapping system using Harmonized Landsat–Sentinel-2 data, a global product that blends the strengths of two satellite fleets into consistent pictures of Earth’s surface every few days at 30 meter detail. They focused on two simple indicators that satellites can measure: how green the land is, and how much water is present in the plants and soil. By tracing how these signals rise and fall through the growing season, they captured each crop’s growth rhythm, such as the early spring peak of wheat, the long summer rise of cotton, or the flooded fields of rice.
Teaching a smart classifier to recognize fields
To translate these seasonal patterns into crop labels, the team combined thousands of field and image based samples collected in 2018 and 2019 with a machine learning method known as a random forest. First, they screened out non farmland using an existing national land cover map, so the model concentrated on true fields. Then they fitted smooth mathematical curves to the satellite signals, turning noisy image sequences into clean growth profiles. The random forest learned how different crops typically behave through the year and then applied this knowledge to every suitable satellite pixel across Xinjiang for each year from 2013 to 2024.
Testing how well the maps match reality
Any automated map needs careful checking. The team held back part of their field and image samples as an independent test set and compared them with the model’s guesses. For the two validation years, most major crops achieved user and producer accuracies above 83 percent, and the overall accuracy reached 90 and 93 percent. They also summed up the mapped area of each crop by county and compared these values with official statistics and with other specialist crop maps for cotton, maize, and wheat. The satellite based estimates tracked these independent sources closely, especially for cotton, suggesting that the maps capture not only where crops are grown but also how their areas shift over time.
What this means for food and the environment
The result of this work is a public, 30 meter resolution record of Xinjiang’s major crops from 2013 onward, updated as new satellite data arrive. For non experts, this means that questions such as how fast cotton has expanded, where maize replaces wheat, or how orchards spread along new canals can now be answered with clear visual evidence. While the authors note remaining uncertainties, especially for mixed or minor crop groups, the dataset offers a powerful tool for monitoring regional food production, guiding water and land policy, and studying how agriculture interacts with fragile desert and mountain ecosystems.
Citation: Liang, Q., Di, Y., Hao, X. et al. A 30 m Multi-Year Dataset of Major Crop Distributions in Xinjiang, China (2013–2024) Based on Harmonized Landsat–Sentinel-2 Data. Sci Data 13, 730 (2026). https://doi.org/10.1038/s41597-026-07082-w
Keywords: crop mapping, remote sensing, Xinjiang agriculture, satellite data, food security