Clear Sky Science · en
A comprehensive China topsoil dataset of high-resolution microstructure, topographical characteristics and physical properties
Why the spaces in soil matter
We usually think of soil as a solid mass of dirt, but under a microscope it looks more like a sponge full of tiny tunnels and chambers. These hidden spaces control how rainwater sinks into the ground, how roots grow, how microbes live, and how much carbon the land can store. This article describes a new national dataset that turns the top few centimeters of soil across China into detailed 3D pictures, helping scientists see and measure this secret inner world with far greater clarity.
Looking beneath the surface
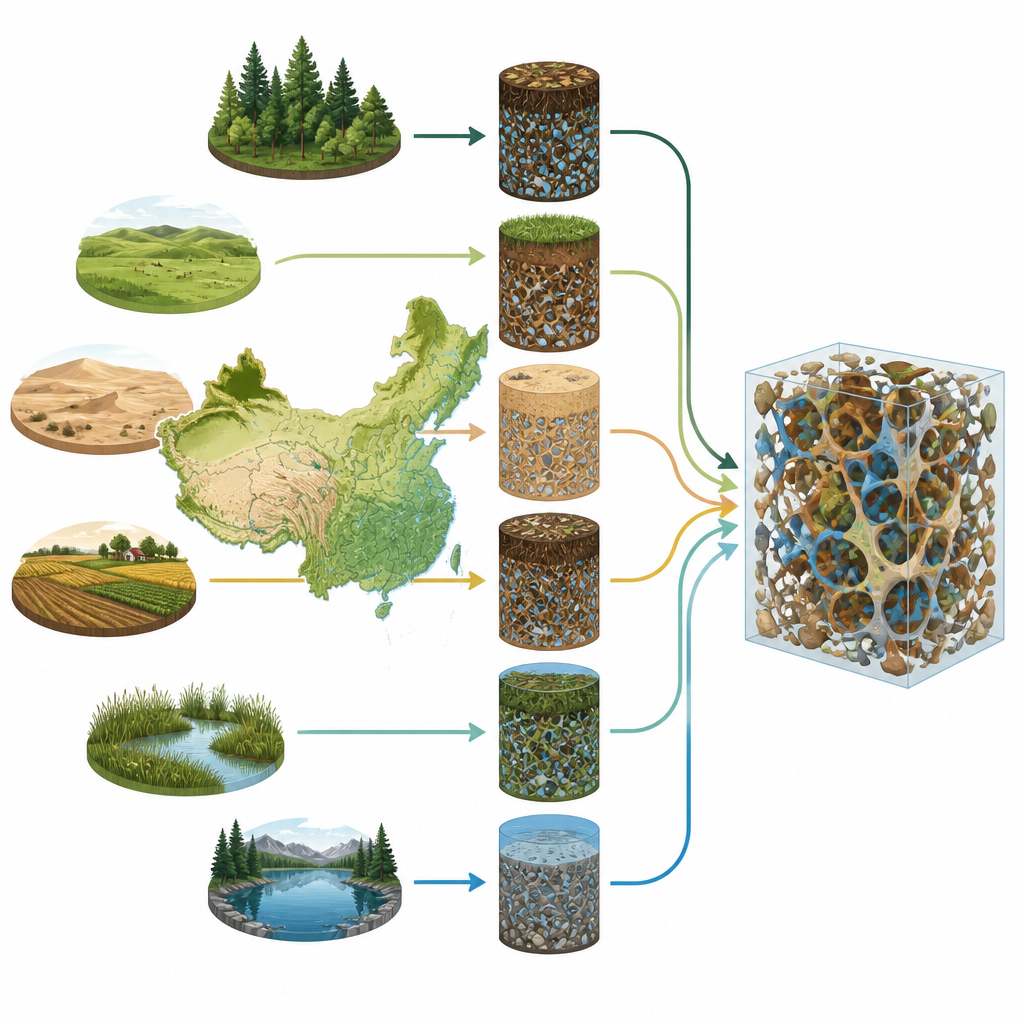
The researchers set out to solve a basic problem: most soil databases describe what soil is made of, but not how it is arranged inside. Yet the internal structure controls how air and water move and how nutrients and pollutants spread. To fill this gap, they built CHARM3D, a collection of high resolution 3D images and measurements of topsoil from sites spread across China. The samples come from six major landscape types, including farms, forests, grasslands, deserts, wetlands, and lake shores, covering many of the country’s main soil groups and climates.
Building a 3D picture of soil
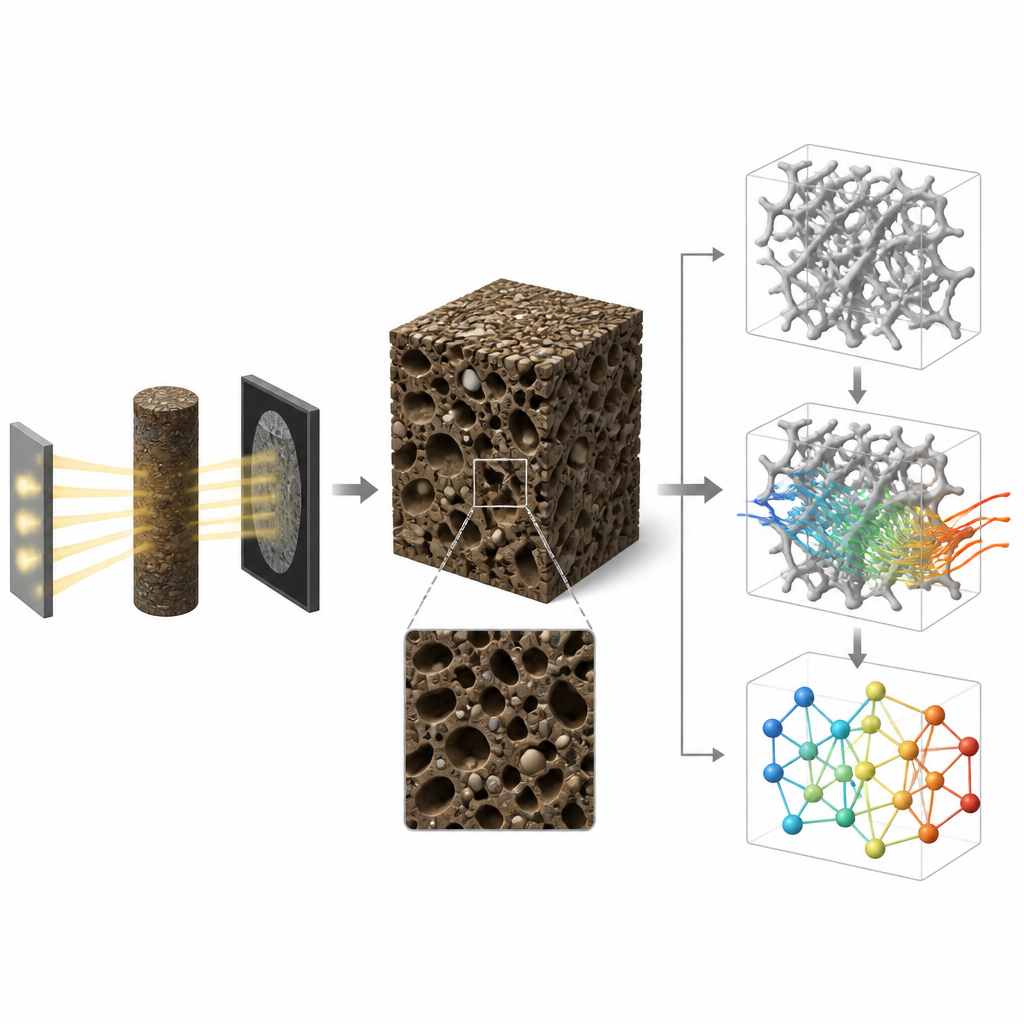
To capture soil structure without disturbing it, the team collected intact cores from the top 10 centimeters of ground using plastic rings that preserve the natural arrangement of grains and pores. In the lab, they scanned each core with industrial X ray computed tomography, a technique similar to a medical CT scan but at much finer detail. Each scan produced thousands of image slices that were stitched into a 3D block, where brighter and darker tones reveal minerals, organic matter, and empty pore spaces. Careful digital filtering and automatic thresholding turned these grayscale blocks into clean maps of solids and voids.
Turning images into numbers
The 3D images are only the starting point. The authors used specialized software to calculate how much of each sample is empty space, how rough and convoluted the pore walls are, and how well individual pores are connected to one another. They treated the pore network like a social network, where each pore is a node and each narrow passage is a link. Measures such as how many links each pore has, how closely clusters of pores are tied together, and how many “shortcut” pores lie on many possible flow paths all help describe how easily water and dissolved substances can move. The team also trained a machine learning tool to pick out bits of organic matter in the images, providing a new way to estimate how much carbon rich material is present and how it is distributed through the pore space.
From pictures to flow and function
To explore how structure controls behavior, the researchers fed these pore maps into computer models that simulate slow fluid flow through the actual 3D geometry. By solving standard flow equations inside the mapped pores, they estimated the permeability of each sample, a measure of how readily water can move. They then examined how permeability changes with porosity and with pore connectivity across different ecosystems. In general, samples with more and better connected pores allowed water to pass more easily, but the details depended on subtle differences in the shape and linking of the pore network, highlighting why simple averages are not enough to capture soil behavior.
What this means for people and the planet
The CHARM3D dataset gives scientists an unprecedented view of how the “architecture” of topsoil varies across China and how this architecture influences water, carbon, and nutrient movement. Because the data are openly available and include both raw images and ready to use summary numbers, they can be plugged into models that predict flooding, drought impacts, crop yields, and soil carbon storage. For non specialists, the key message is that what happens underground depends not just on what soil is made of, but on how its invisible pores are arranged. This new atlas of soil microstructure will help link that hidden design to the health and resilience of ecosystems at the land surface.
Citation: Li, X., Duan, H. & Yang, X. A comprehensive China topsoil dataset of high-resolution microstructure, topographical characteristics and physical properties. Sci Data 13, 769 (2026). https://doi.org/10.1038/s41597-026-07049-x
Keywords: soil microstructure, X ray computed tomography, pore network, soil permeability, soil dataset