Clear Sky Science · en
Global basin-scale mapping of pH and alkalinity in inland waters
Why the chemistry of lakes and rivers matters
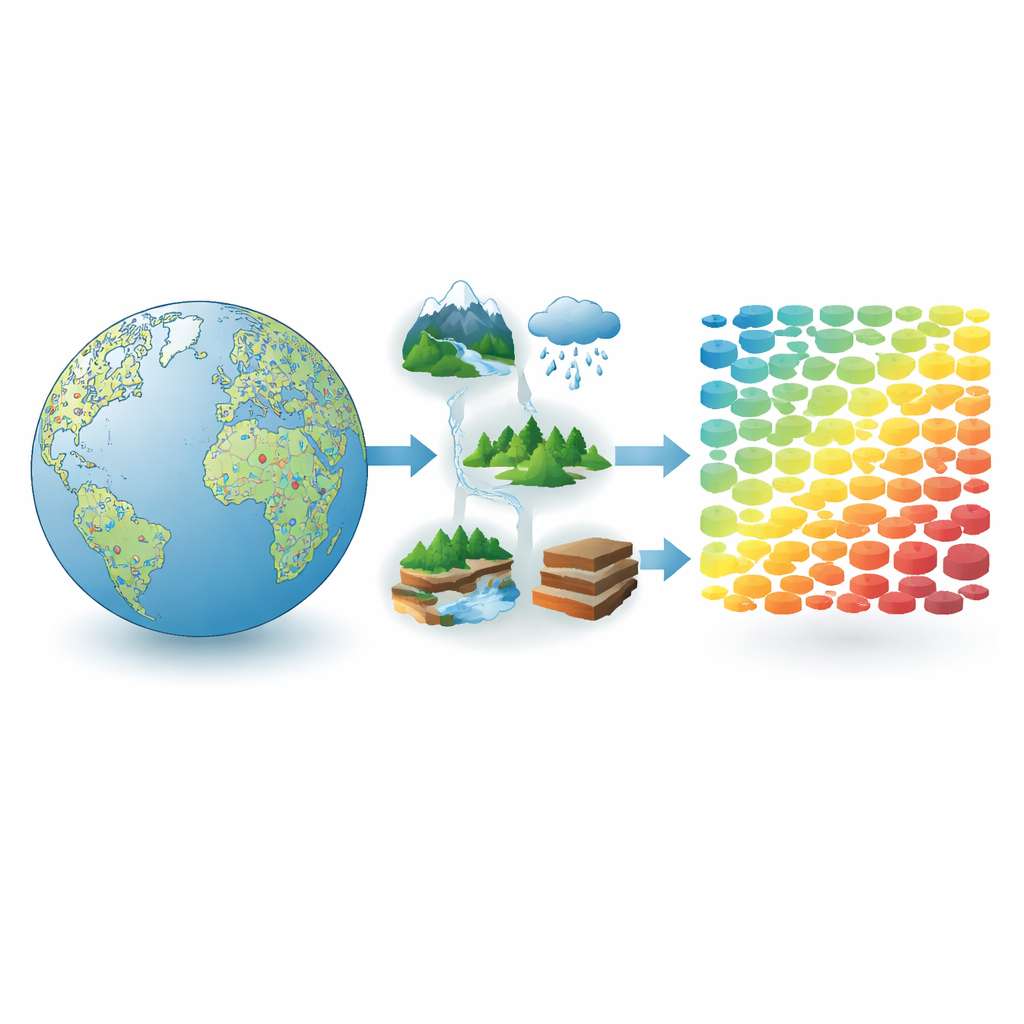
Whether a stream teems with life or struggles to support even algae depends strongly on two quiet characters: how acidic the water is and how well it can buffer that acidity. These properties, known as pH and alkalinity, shape which species can live where, how pollutants behave, and how much carbon inland waters can store or release. Yet until now, scientists lacked a detailed global picture of how these traits vary from one river basin to another. This study presents the first worldwide, basin-scale maps of pH and alkalinity for inland waters, built from a massive compilation of measurements and modern data‑science tools.
Gathering scattered clues from around the world
Measurements of water chemistry have been collected for decades, but they are scattered across many national monitoring programs, regional projects, and individual research studies. The authors pulled together data on pH and alkalinity from 18 large databases and 55 scientific papers, covering rivers, lakes, reservoirs, and wetlands on all continents. In total, they compiled more than 100,000 sites with pH data and about 51,000 sites with alkalinity measurements. Because some areas, such as North America and Europe, are studied far more intensely than others, the raw data were heavily skewed toward these regions, leaving large gaps in Africa, South America, and parts of Asia and Oceania.
Checking the reliability of water samples
Creating a trustworthy global map required more than just stacking numbers. The team first harmonized the information: they translated different units into common ones, aligned coordinates and map systems, and removed duplicate sites. To check whether alkalinity readings were credible, they compared the balance of positively and negatively charged ions in each sample and contrasted measured values with what would be expected from related properties such as conductivity. When systematic errors, like unit mix‑ups in parts of some national datasets, were detected, they were corrected. For samples lacking full ion information, the authors trained a simple statistical classifier to estimate whether they were likely high or low quality. In the end, they retained over 50,000 alkalinity sites and nearly 108,000 pH sites judged good enough for global modeling.
Linking water chemistry to landscape features
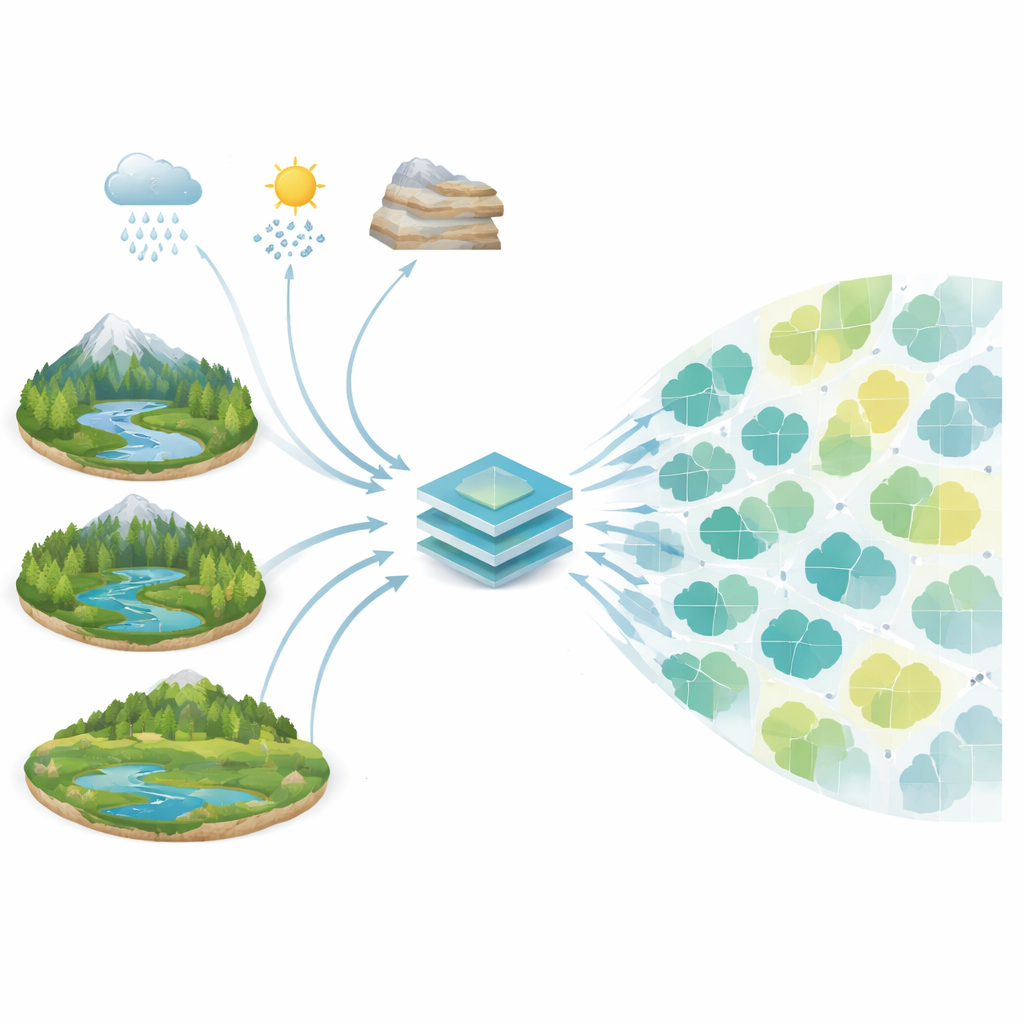
Because it is impossible to sample every lake and stream on Earth, the study turned to the landscape itself as a guide. Using global map products, the researchers described each drainage basin – the land area that feeds water into a river system – in terms of its climate, topography, and geology. They included factors such as runoff, elevation, slope, snow cover, forest cover, air temperature, distance to the ocean, and the types of rocks in the upstream area. Many of these features influence how rocks weather, how much dissolved material enters the water, and how carbon dioxide interacts with it, all of which affect pH and alkalinity. A machine‑learning approach called random forests then learned the relationships between these basin traits and the observed chemistry, and used them to predict conditions in more than one million basins worldwide.
What the new global maps reveal
The resulting PHALK dataset shows clear patterns in how inland water chemistry varies across the planet. Regions underlain by carbonate‑rich sedimentary rocks, such as many mid‑latitude lowlands, tend to have higher alkalinity and neutral to slightly basic pH, meaning these waters can buffer added acids well. In contrast, basins in parts of the Arctic, Scandinavia, Canada, and tropical regions with certain rock types often have lower alkalinity and sometimes lower pH, making their ecosystems more sensitive to acid inputs and chemical change. Overall, inland surface waters are mostly well buffered, with pH values between 7 and 8 dominating the global water area. The analysis also identifies the environmental factors that matter most: surface runoff emerged as the top driver for both pH and alkalinity, followed by elevation, carbonate rock abundance, distance to the sea, forest cover, and air temperature.
Understanding and communicating uncertainty
Because measurements are unevenly distributed, the authors carefully assessed how trustworthy their predictions are in different basins. They computed how similar each basin’s environment is to those where measurements exist, flagging areas where the model must extrapolate into unfamiliar combinations of climate, terrain, and rock types. They also used the internal variability of the random‑forest model to estimate how stable each prediction is. Together, these two indicators help users see where the maps are built on strong foundations and where they are more tentative, which is crucial for applications ranging from biodiversity research to water‑quality management and carbon‑cycle studies.
What this means for people and nature
By turning scattered measurements into coherent global maps, this work provides a new baseline for understanding the chemical backdrop of freshwater life. For ecologists, the PHALK dataset highlights where species may face harsher chemical conditions or greater sensitivity to pollution. For climate and carbon researchers, it clarifies how geology and water flow shape the ability of lakes and rivers to store or release carbon. For managers and policymakers, it offers a way to compare basins, spot vulnerable regions, and prioritize monitoring in places where predictions are least certain. In short, the study transforms our patchy knowledge of freshwater acidity and buffering into a global resource that can guide both science and stewardship.
Citation: Batalla, M., Martínez-Artero, J. & Catalan, J. Global basin-scale mapping of pH and alkalinity in inland waters. Sci Data 13, 686 (2026). https://doi.org/10.1038/s41597-026-07028-2
Keywords: freshwater chemistry, global mapping, river basins, pH and alkalinity, water quality data