Clear Sky Science · en
A dataset on topsoil salinization characteristics in the Tailan River Irrigation District on the northern margin of the Tarim Basin in Xinjiang
Why salty soil matters for farms
Across the world’s drylands, invisible crusts of salt are quietly eating away at our ability to grow food. In China’s far‑western Xinjiang region, farmers depend on irrigation to turn desert into productive fields, but the same water can slowly concentrate salts in the soil and weaken crops. This article describes a new, detailed dataset that maps how water, salt and soil conditions vary across a large irrigation district along the Tailan River. For readers, it offers a window into how scientists diagnose a hidden threat beneath our feet—and how better data can help protect harvests in a warming, drying world.
The setting: an oasis under pressure
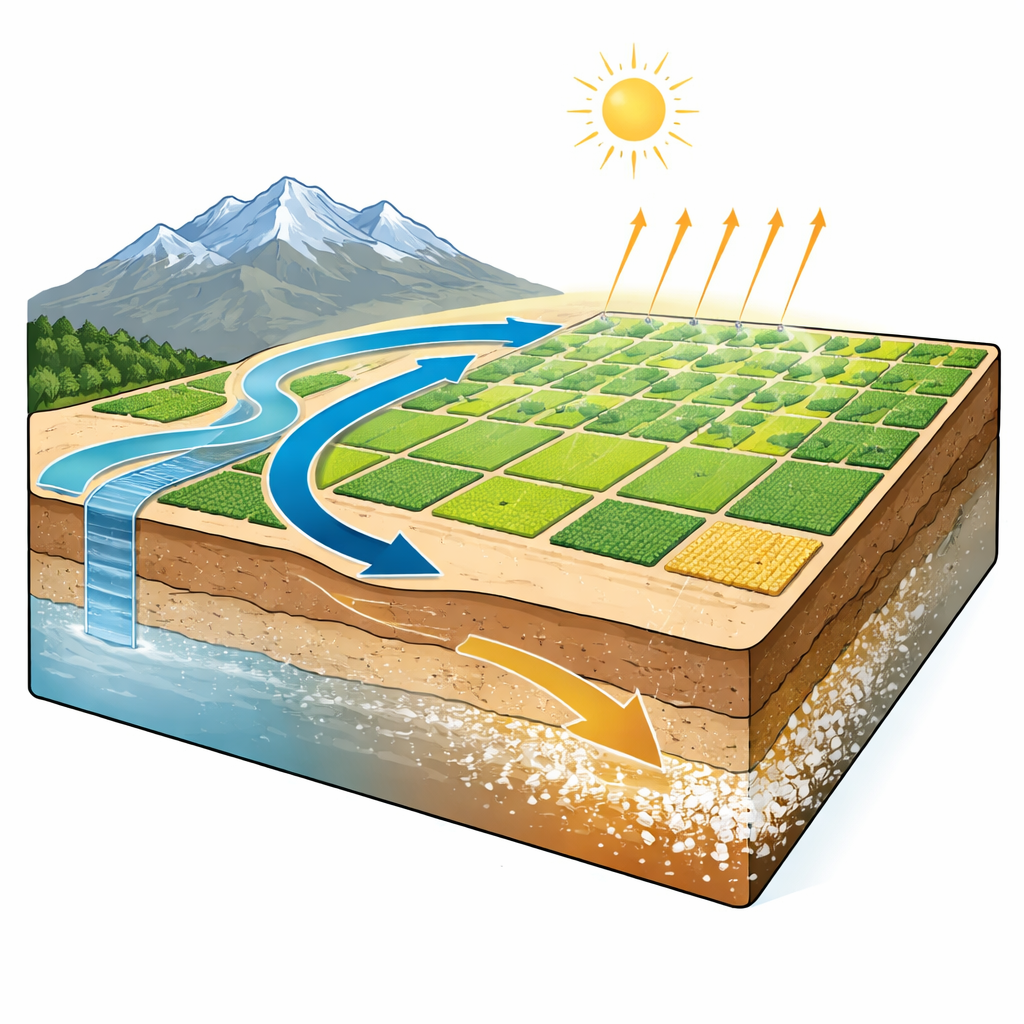
The study focuses on the Tailan River Irrigation District, an artificial oasis on the northern edge of the Tarim Basin in Xinjiang. This region has very little rain but extremely high evaporation, so farmers rely heavily on river water and wells to grow cotton, grain and fruit. Over decades, canals, pumps and, more recently, drip irrigation under plastic film have transformed the landscape into a patchwork of fields. Yet the same engineering successes have created new problems. Less seepage from lined canals and intensive pumping have lowered groundwater levels, while shifts in irrigation methods have triggered “secondary salinization,” in which salts move and re‑accumulate in the root zone. Until now, there had been no comprehensive field survey of soil salinity here for about twenty years, leaving managers to guess where conditions were worsening.
Taking the pulse of the soil
To fill this gap, the researchers designed a grid of 164 sampling points across the irrigation district, spaced about two to two and a half kilometers apart. At each point they collected soil from the surface down to 1.2 meters, slicing the profile into seven depth layers. In the lab, they measured a set of key properties: moisture content (how wet the soil is), acidity or alkalinity (pH), electrical conductivity (how well the soil solution carries current, a fast proxy for saltiness), total soluble salts, and the amounts of eight major ions such as sodium, chloride and sulfate. All tests followed national and international standards, with careful calibration, repeated measurements at selected sites, and screening for inconsistent values. After this quality control, 118 sampling points and 807 individual soil samples were retained as the core of the dataset, which is now openly available in spreadsheet form for other researchers and planners.
What the maps reveal beneath the fields
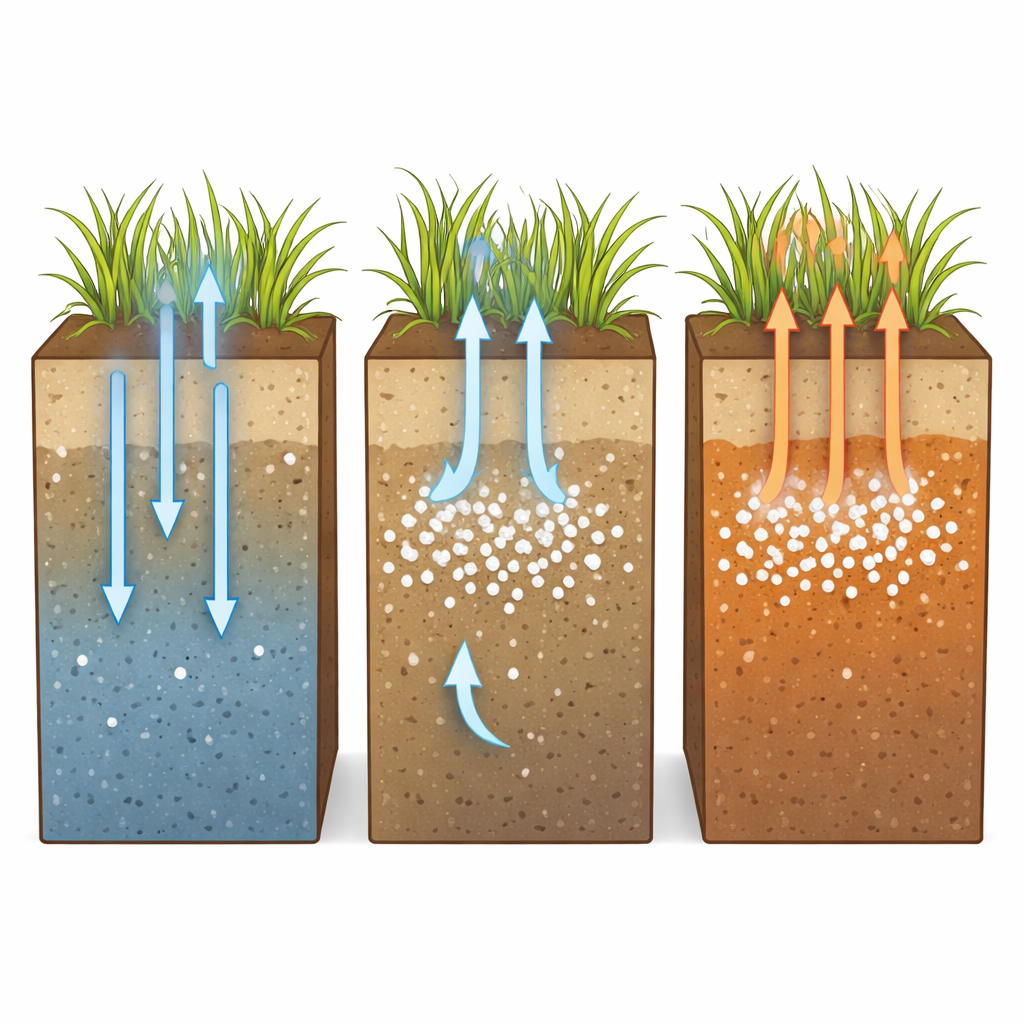
Using geographic information software, the team converted the point measurements into smooth maps that show how soil conditions vary both across the landscape and with depth. Soil moisture is generally higher in the southeast of the district and tends to increase with depth, especially below about 40 centimeters, while the drier northwest and desert fringe show very low surface moisture. Soil pH ranges from slightly acidic to mildly alkaline, becoming more stably alkaline in deeper layers. Total soluble salts and electrical conductivity—two complementary ways of expressing salt load—both rise from northwest to southeast. They are highest near the surface and decline with depth, and their spatial patterns closely match each other, as expected if they are tracking the same underlying salt buildup.
The fingerprints of different kinds of salt
Beyond overall saltiness, the dataset captures which salts dominate in different areas. Chloride ions are mostly concentrated in the upper 5 centimeters and increase from northwest to southeast, with pockets of enrichment deeper down in the south and east. Sulfate ions are even more abundant and form a slightly different pattern, with lower levels in the southwest and stronger accumulation in central and eastern zones, especially in the upper 40 centimeters. By combining these trends with established classification rules, the researchers mapped zones of “chloride‑type” and “sulfate‑type” saline soils and assigned each area to slight, moderate or severe salinization classes based on salt content. The results show that sulfate‑type saline soils dominate across depths, with chloride‑type soils occupying smaller pockets.
From broad concern to targeted action
For non‑specialists, the key takeaway is that this work does not simply describe a problem—it provides a practical tool for fixing it. The new dataset turns a vague awareness of “salty soil” into detailed, location‑specific information about how much salt is present, how deep it goes, and what kind it is. Farmers and engineers can use this information to choose where to prioritize drainage, where to switch irrigation methods, and where to plant more salt‑tolerant crops. Policymakers can use it to design programs that move from coarse, one‑size‑fits‑all measures toward precise, field‑scale management. As climate change and expanding irrigation put more pressure on dryland oases worldwide, such transparent, high‑quality data will be essential for keeping soils healthy and harvests secure.
Citation: Zhang, Q., Gong, M., Luo, W. et al. A dataset on topsoil salinization characteristics in the Tailan River Irrigation District on the northern margin of the Tarim Basin in Xinjiang. Sci Data 13, 604 (2026). https://doi.org/10.1038/s41597-026-06977-y
Keywords: soil salinity, irrigation, Xinjiang, saline-alkali land, topsoil dataset