Clear Sky Science · en
A 0.1° monthly potential evapotranspiration dataset based on the optimal models over global vegetation zones
Why measuring invisible water loss matters
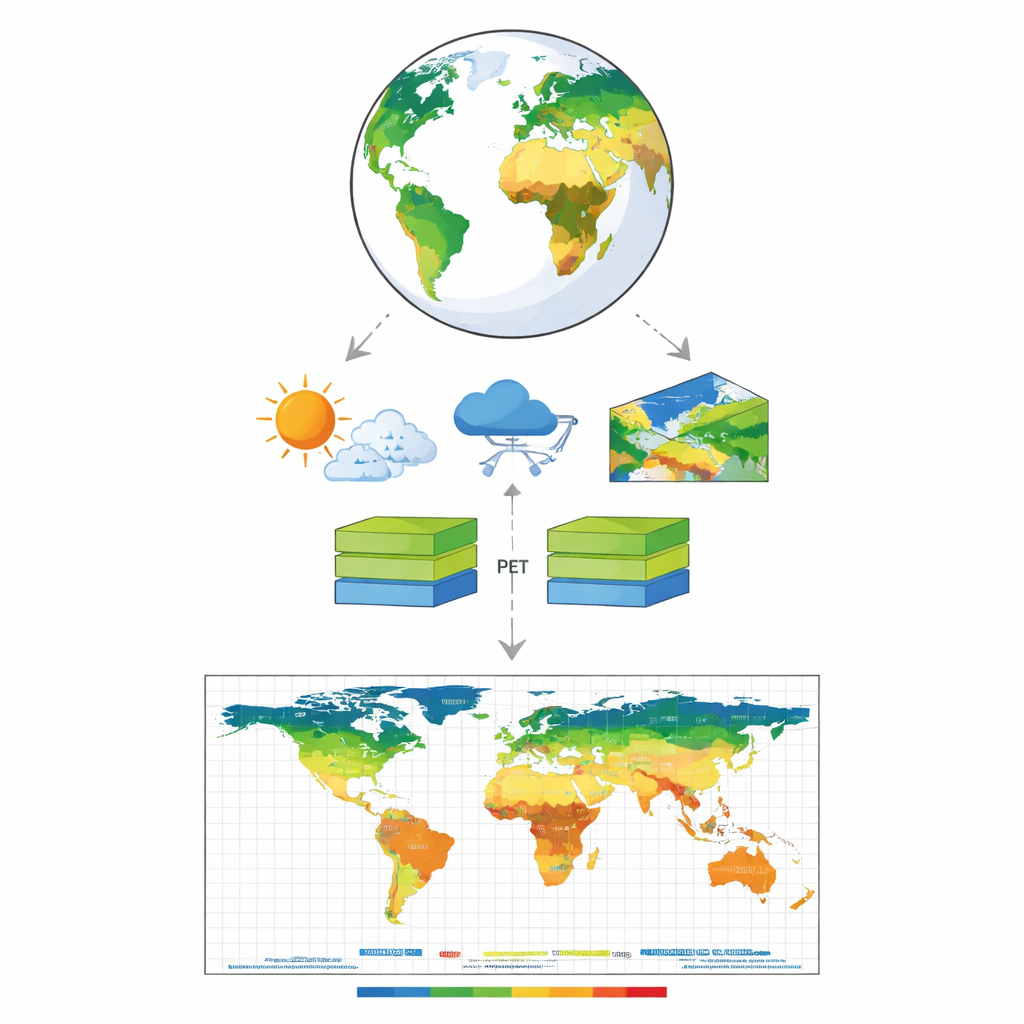
When we think about water, rivers and rain usually come to mind. But a huge part of Earth’s water quietly returns to the air as “evapotranspiration”—water evaporating from soil and open water, and water released by plants. Scientists use a related idea, called potential evapotranspiration, to estimate how thirsty the atmosphere is and how much water could be lost if supplies were unlimited. This matters for farming, drought monitoring, river flows, and even biodiversity. The study behind this article delivers a new, high‑resolution global dataset of this invisible water demand, designed to be more accurate and more realistic than many products in use today.
How scientists estimate the sky’s thirst
Potential evapotranspiration (PET) is a kind of “what if” number: how much water would leave the land if there were no shortage of moisture. It is central to tracking drought, planning irrigation, and understanding how climate change reshapes water cycles. Over the past decades, many mathematical formulas have been developed to estimate PET from weather data such as temperature, radiation, humidity, and wind. These formulas range from simple temperature‑based recipes to more complex approaches that explicitly describe how heat and moisture move between land and air. Global PET products used today often rely on just one or two standard formulas with built‑in default settings, applied wholesale across the planet.
Why existing estimates can be misleading
Using the wrong PET formula—or using it with one‑size‑fits‑all settings—can seriously distort our picture of dryness. Earlier work showed that common methods may exaggerate continental drying, or behave very differently from place to place. For example, one widely used approach performs well in humid regions but falters elsewhere, in part because its key parameter is treated as a fixed constant. Another popular standard sets the same plant height and leaf resistance everywhere, even though real forests, grasslands, wetlands, and croplands differ enormously. As a result, current global PET products can inject hidden uncertainty into studies of climate trends, river flows, crop water demand, and drought indices.
Building a better global picture
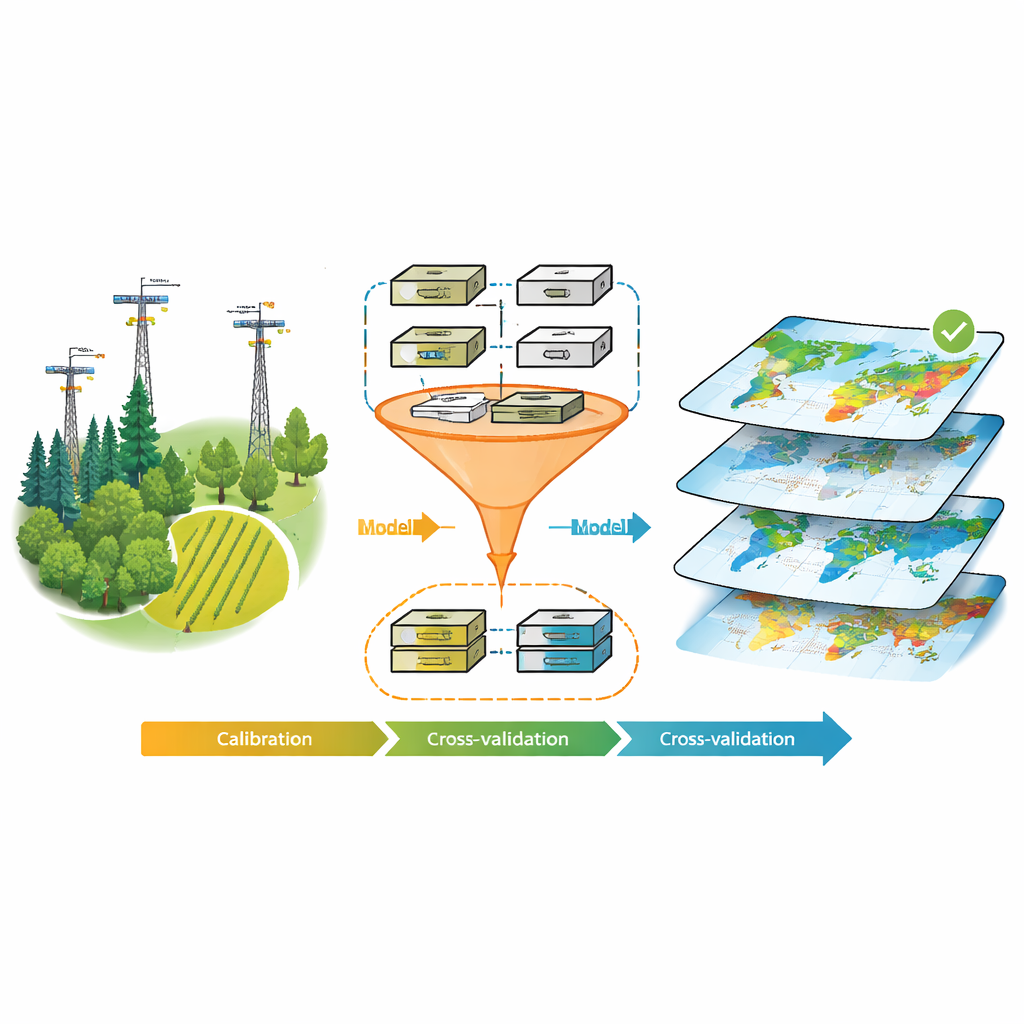
To tackle these issues, the authors turned to direct measurements of heat and water exchange between land and atmosphere, collected at 178 monitoring sites worldwide using tall instrument towers. They focused on 124 sites with the detailed information needed to calibrate five widely used PET formulas, spanning temperature‑based, radiation‑based, and combined approaches. For each biome type—such as evergreen forests, shrublands, savannas, grasslands, wetlands, and croplands—they used a Monte Carlo search to fine‑tune key parameters so that each formula best matched days when plants were not limited by soil moisture. They then rigorously tested how well these tuned models reproduced daily PET, including cross‑checks at sites left out of the calibration and at an independent set of towers.
Choosing the best tools for each landscape
The comparison revealed that two radiation‑focused formulas consistently performed best: the Priestley–Taylor model and the Milly–Dunne model. Depending on the biome, one or the other gave the closest match to tower measurements, typically capturing daily changes in PET very well. Encouragingly, their calibrated settings transferred reliably to new, unseen sites, suggesting that these tuned models can be used confidently beyond the original observation network. Armed with this result, the team combined the chosen models with four major global weather datasets and an annually updated land‑cover map. They produced a monthly PET dataset on a grid of 0.1 degrees (roughly 10 km) for all vegetated land areas from 1992 to 2022, effectively creating a 30‑year movie of the atmosphere’s water demand over different types of landscapes.
How the new map compares and what it reveals
To see how their product stacks up, the researchers compared it to a leading global PET dataset widely used in hydrology and ecology. At most vegetation types, their new estimates followed the tower observations more closely, especially over mixed forests, shrublands, savannas, grasslands, and croplands. When they examined long‑term trends, both datasets showed PET increasing over much of the globe, with some notable pockets of decline in parts of South America and Asia. However, the details sometimes differed by region, partly because the new product relies mainly on available energy at the surface, while the older one is more sensitive to changes in wind and air dryness.
What this means for water, food, and ecosystems
For non‑specialists, the key message is that our yardstick for atmospheric “thirst” just became sharper. By tailoring models to specific vegetation types and using realistic, evolving land‑cover information, this new PET dataset should improve estimates of irrigation needs, strengthen hydrological models, and refine drought and aridity indices. It also opens doors to studying how land‑use change—such as deforestation, wetland loss, or cropland expansion—alters regional water demand and ecological conditions. While uncertainties remain, especially in regions with few measurement towers and in how plant physiology responds to rising carbon dioxide, this work marks a significant step toward more trustworthy, fine‑scale maps of how much water the air is asking from the land.
Citation: Bi, Z., Sun, S., Ma, Q. et al. A 0.1° monthly potential evapotranspiration dataset based on the optimal models over global vegetation zones. Sci Data 13, 580 (2026). https://doi.org/10.1038/s41597-026-06956-3
Keywords: potential evapotranspiration, global water cycle, drought monitoring, land use change, climate data