Clear Sky Science · en
A Four-Wavelength Photoplethysmography dataset for non-invasive hemoglobin assessment
Why shining light on a fingertip can reveal blood health
Most of us are familiar with the pinch of a needle when getting our blood tested for anemia, diabetes, or heart problems. Now imagine checking some of these same measures simply by resting your finger on a small sensor, much like a pulse oximeter. This article introduces a research dataset designed to help scientists build and test such non-invasive methods for estimating hemoglobin—the oxygen-carrying component of blood—as well as related signs of cardiovascular health.
From blood draws to light-based checks
Hemoglobin levels are central to health: too little can signal anemia and fatigue, while too much can thicken blood and strain the heart. Today, the definitive way to measure hemoglobin is to draw blood from a vein and analyze it in a laboratory—accurate, but uncomfortable, slow, and dependent on trained staff and equipment. In recent years, researchers have turned to optical techniques that might estimate hemoglobin and other indicators without a needle, opening the door to easier screening in clinics, homes, and low-resource settings.
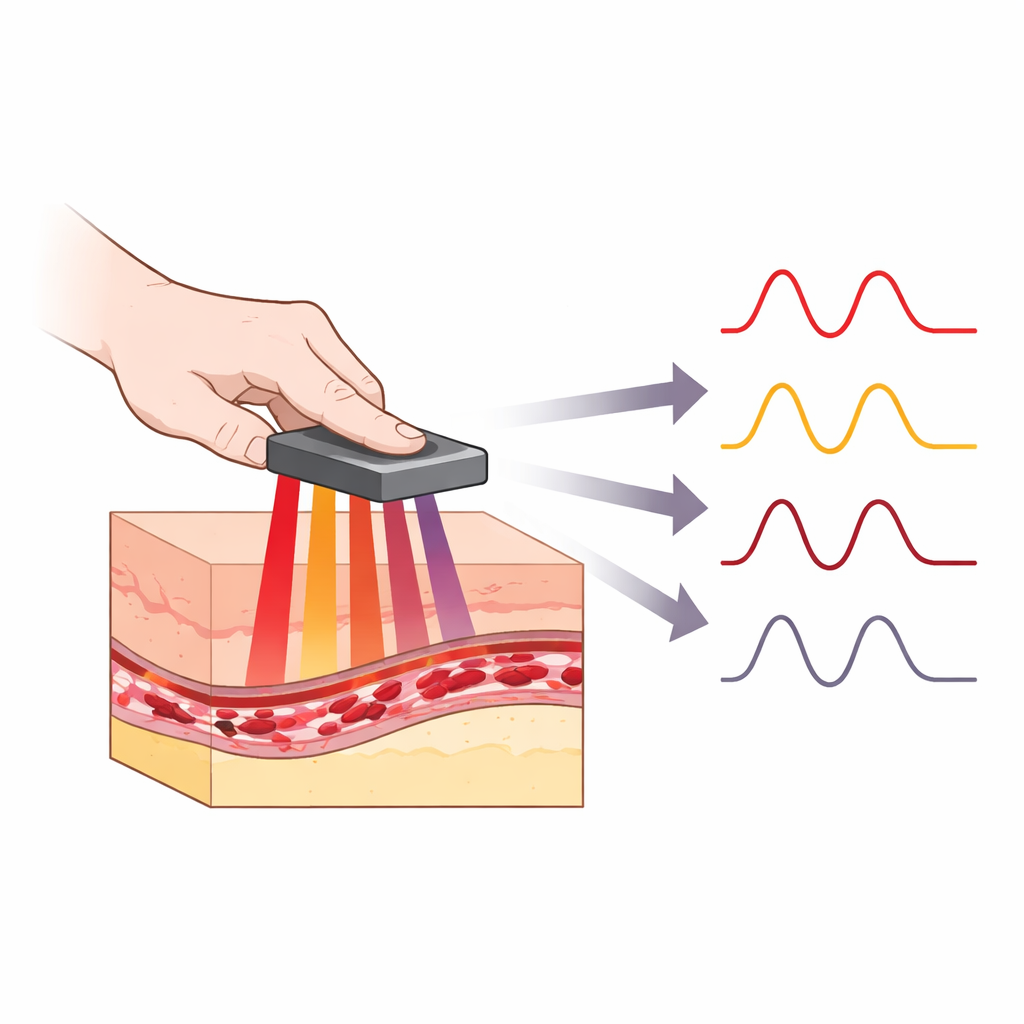
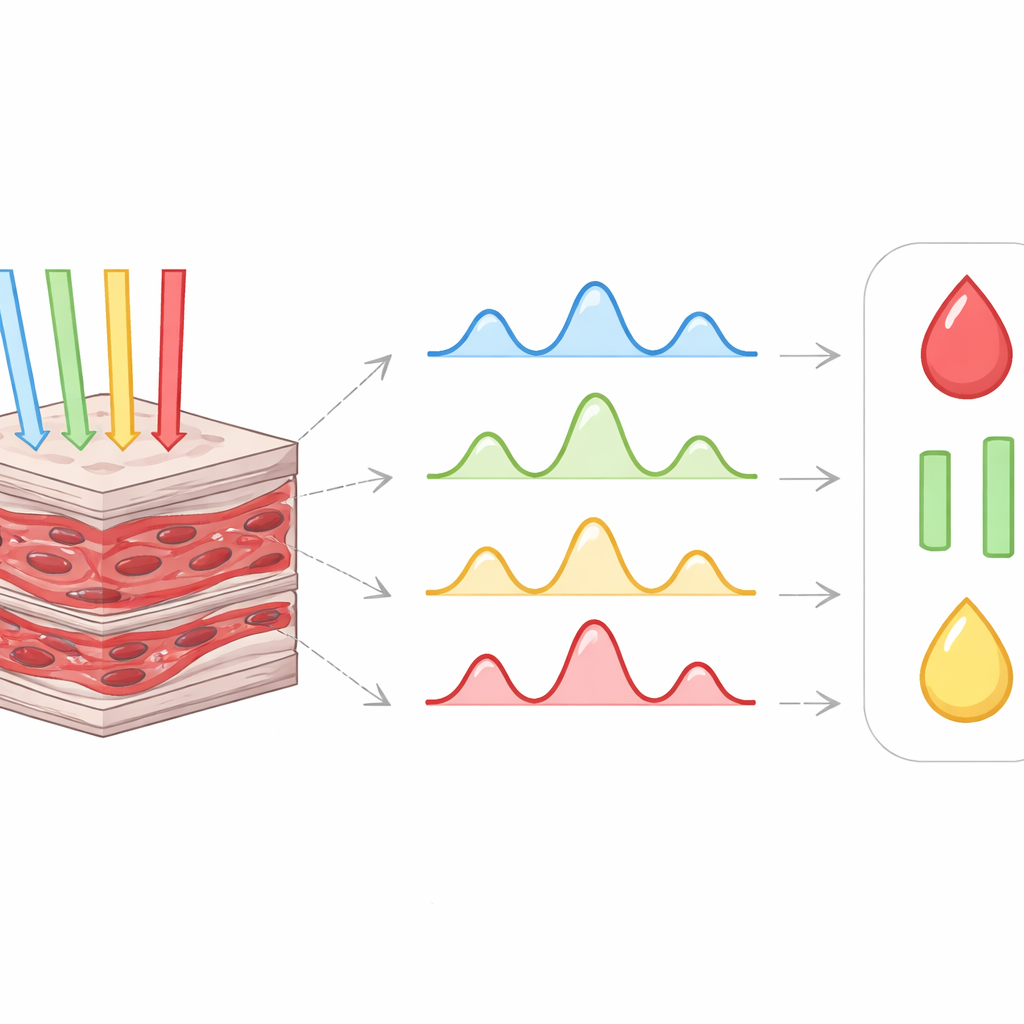
Reading the pulse with colored light
The dataset described in this work is built around photoplethysmography, or PPG, a method that tracks tiny changes in blood volume by shining light into the skin and detecting the light that bounces back. Different colors (wavelengths) of light penetrate to different depths and are absorbed differently by oxygen-rich and oxygen-poor hemoglobin. Instead of relying on just one or two colors, the researchers collected PPG signals at four wavelengths—660, 730, 850, and 940 nanometers—from the fingertips of 252 adults. Alongside these signals, they recorded each person’s lab-measured hemoglobin, fasting blood glucose, and arm blood pressure, creating a rich reference for future algorithms.
How the signals and reference data were collected
To build this resource, the team designed a dedicated fingertip sensor and computer interface. The device combines multiple light-emitting diodes, a light detector, and a pressure sensor that helps keep contact with the skin consistent. During a roughly 15-minute visit, volunteers first had a standard venous blood draw for precise measurements of hemoglobin and glucose. Next, they sat quietly while the sensor recorded one minute of four-channel PPG data from the left index finger at 200 samples per second. Finally, an automated cuff measured systolic and diastolic blood pressure on the right arm. The participants spanned ages 21 to 90, with both sexes represented and a mix of normal values and conditions such as anemia, diabetes, and hypertension, making the dataset more reflective of real-world diversity.
Ensuring clean, trustworthy waveforms
Because noisy signals can mislead any automated method, the researchers invested effort in checking data quality. They screened out records with missing information, severely distorted waveforms, or recordings shorter than 30 seconds. For the remaining data, they quantified signal quality using a standard measure called signal-to-noise ratio, which compares useful pulse information to background noise. They filtered the signals to keep heart-related rhythms while suppressing slow drifts and high-frequency interference, then calculated this ratio for each wavelength. Most recordings had strong, clean pulses, and the analysis revealed systematic differences between wavelengths: for example, signals around 850 nanometers tended to be more stable, while the longest wavelength, 940 nanometers, was more variable—likely reflecting how light of different colors travels and scatters through layered skin and blood.
What researchers can do with this resource
The resulting Hb-PPG collection contains 1,008 four-wavelength PPG segments plus a table of de-identified background information and clinical measurements, all stored in common file formats that work with tools like MATLAB and R. With these, investigators can explore how waveform shapes, timing, and simple statistics relate to hemoglobin, blood pressure, and glucose; compare the strengths of different wavelengths; and design machine-learning models that estimate health parameters from fingertip signals alone. The authors also highlight possibilities for combining these data with heart and brain imaging in future work, potentially linking simple optical readings to deeper insights about circulation and organ function.
Toward gentler blood checks for everyday health
In plain terms, this article does not announce a finished gadget that can replace blood tests. Instead, it offers the detailed raw material needed to create and fairly test such tools: carefully recorded light-based pulse signals, paired with gold-standard lab measurements, and vetted for quality. By making this dataset openly available, the authors aim to speed progress toward comfortable, repeatable, and widely accessible ways to track hemoglobin and cardiovascular health—turning a fingertip’s changing color and pulse into a window on the body’s inner state.
Citation: Chen, L., Li, S., Liu, L. et al. A Four-Wavelength Photoplethysmography dataset for non-invasive hemoglobin assessment. Sci Data 13, 564 (2026). https://doi.org/10.1038/s41597-026-06945-6
Keywords: non-invasive hemoglobin monitoring, photoplethysmography, multi-wavelength optical sensing, anemia screening, wearable health devices