Clear Sky Science · en
A long-term gridded dataset of aboveground net primary productivity for global natural grasslands
Why Grasslands Matter to Everyday Life
Grasslands may look like simple stretches of green, but they quietly feed much of the world’s livestock and store huge amounts of carbon. Knowing how much plant matter these ecosystems grow each year above the soil surface is key for predicting food supplies, wildlife habitat, and climate change. This article presents a new, long-term global dataset that tracks how productive natural grasslands have been in the past and how they might change in the future as the climate warms.
Measuring the Green Engine of the Planet
Scientists describe plant growth as “net primary productivity,” the net amount of carbon plants turn into new tissue. For people and grazing animals, the aboveground portion of that growth—leaves and stems—is especially important. Grasslands cover roughly half of the world’s ice‑free land and contribute about one‑third of all land‑based plant production, so small shifts in their growth can ripple through global food systems and the carbon cycle. Yet most global datasets blur together what happens above and below ground, or they describe only today’s disturbed landscapes, not the natural baseline needed to judge human impact.
Building a Global Picture from Ground to Sky
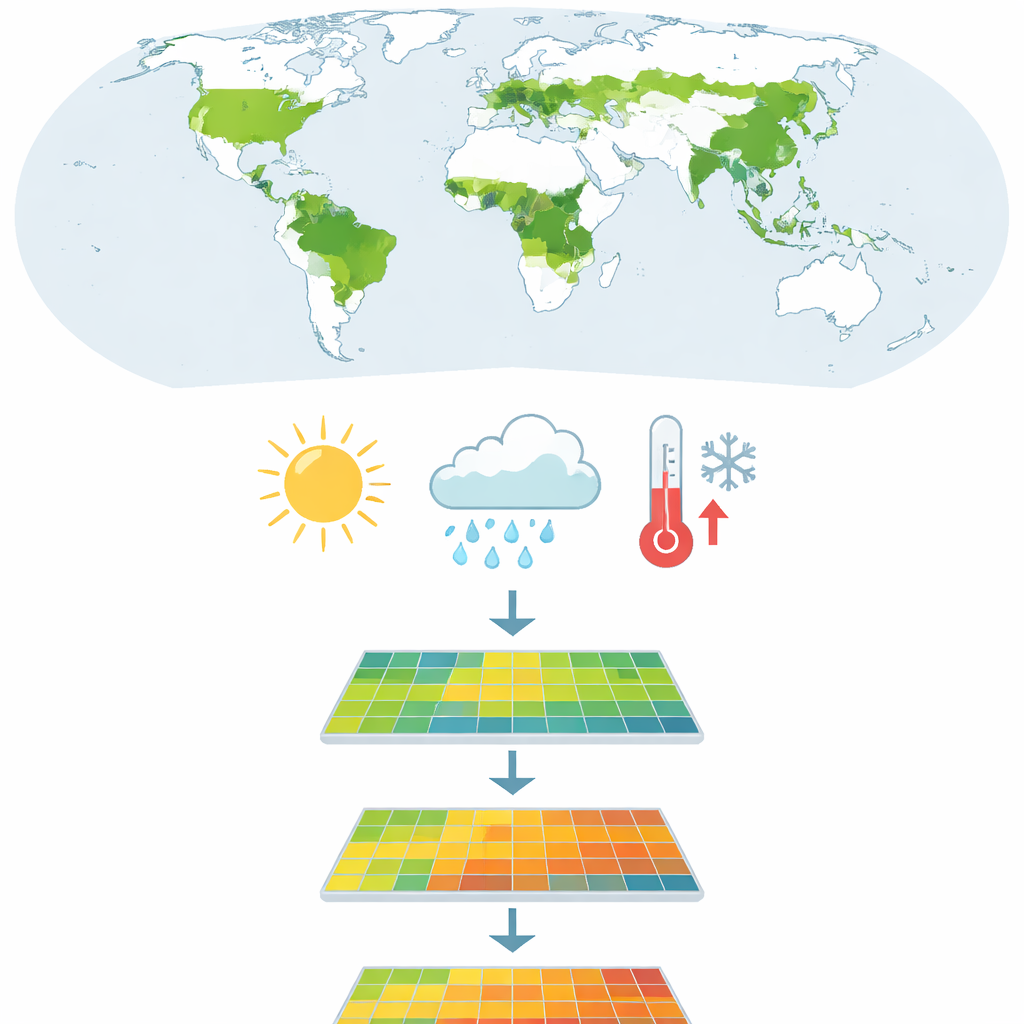
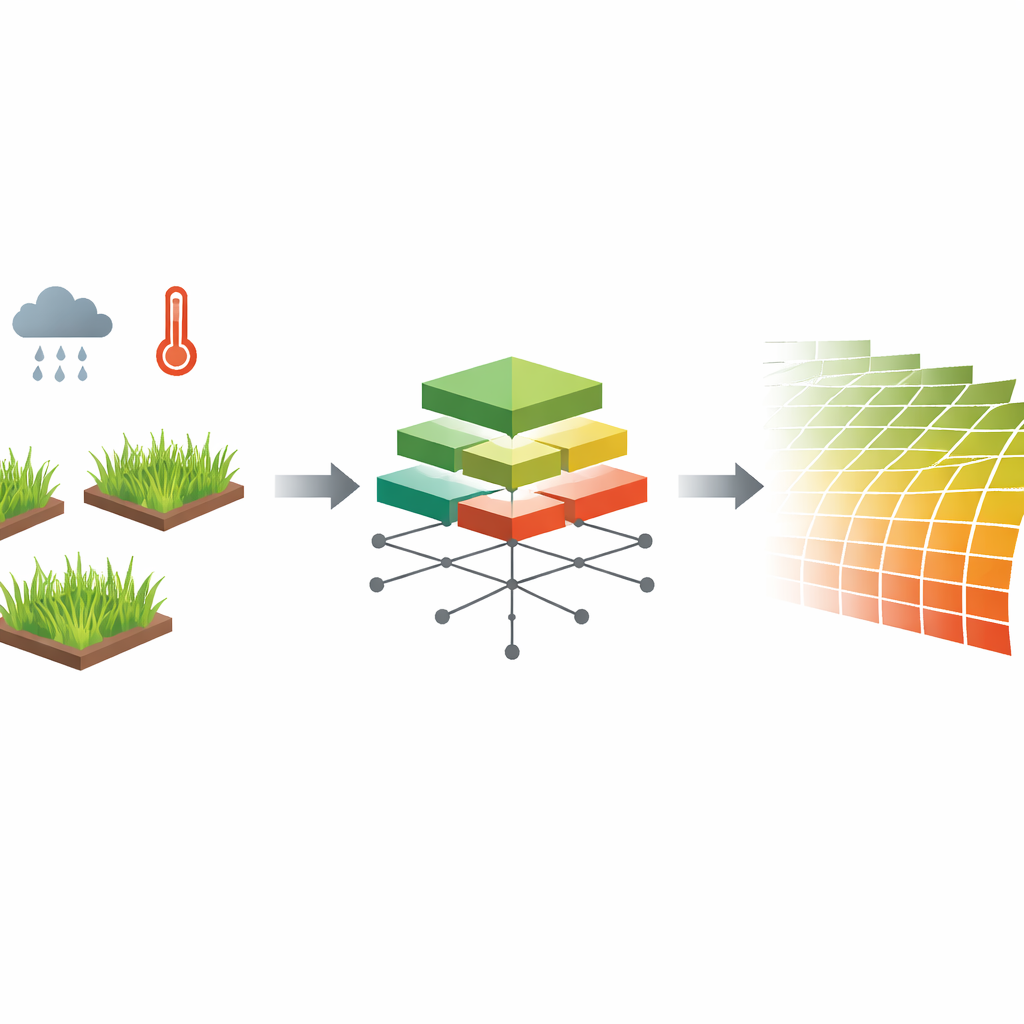
The authors created a worldwide, grid‑based map of aboveground grass growth for natural, undisturbed grasslands from 1958 all the way to 2100. They first compiled more than 1,500 field measurements from research plots on nearly every continent, focusing on control sites without grazing. They paired these site records with an earlier high‑resolution map of long‑term average grassland productivity, and with detailed climate information—temperature, rainfall, sunlight, and water balance—drawn from historical records and modern climate‑model projections. This allowed them to ask how year‑to‑year weather swings around a local baseline help explain how much grass actually grows each year.
Teaching a Digital Forest to Predict Grass Growth
To turn these scattered measurements into a continuous global picture, the team used several machine‑learning methods and found that a “random forest” approach gave the best balance of accuracy and robustness. In simple terms, this method builds many decision trees that each suggest how climate and long‑term site conditions translate into plant growth; their combined verdict yields a reliable estimate. The model was trained to link field‑measured grass growth with long‑term average productivity and with annual climate “anomalies” – how each year’s weather differed from the 1970–2000 norm. After carefully testing performance with different cross‑validation schemes to avoid overfitting to particular regions or climates, they selected the top‑performing version and used it to estimate yearly productivity for each grid cell on Earth.
Checking the Maps Against Other Lines of Evidence
The resulting dataset was then checked against existing global products. Spatially, the new maps reproduce well‑known patterns: productive savannas in central Africa and eastern South America, and much sparser growth on high, cold plateaus such as Tibet. Statistical comparisons show strong agreement with four previous datasets, and realistic levels of spatial clustering. Over time, the team compared their results with two long‑running satellite‑based plant growth products and outputs from 20 independent ecosystem models. In most grassland regions, the ups and downs of the new dataset track those other sources closely, suggesting that it captures the main climate‑driven swings in grassland growth. Some mismatches emerge in special cases, such as places where woody plants are invading grasslands or where warming pushes plants to invest more growth into roots than leaves.
Limits, Caveats, and How This Helps People
Despite its strengths, the dataset has blind spots. In very lush grasslands with extremely high plant growth, field measurements are rare, so the model tends to underestimate how much grass is produced. Users are urged to be cautious when working in these regions and, where possible, to adjust the numbers with local data. Even so, the new maps provide something that did not exist before: a long, consistent, spatially detailed record of how much forage natural grasslands can produce under a given climate, separate from direct human disturbance.
What This Means for the Future of Grasslands
For non‑specialists, the key message is that we now have a clearer baseline for how productive the world’s natural grasslands are—and how that productivity responds to weather and long‑term climate change. This makes it easier to gauge how much of today’s changes in grass growth come from grazing, land‑use shifts, or climate extremes, and to plan more sustainable use of rangelands. As climate continues to change through this century, the dataset can help policymakers, ranchers, and conservationists anticipate where grasslands may struggle or thrive, improving decisions about livestock numbers, restoration efforts, and protection of these vital green engines of the planet.
Citation: Chen, Z., Zhao, D., Zhang, Z. et al. A long-term gridded dataset of aboveground net primary productivity for global natural grasslands. Sci Data 13, 550 (2026). https://doi.org/10.1038/s41597-026-06944-7
Keywords: grassland productivity, carbon cycle, climate change impacts, machine learning ecology, rangeland management