Clear Sky Science · en
Development of Gridded Root-Zone Soil Moisture Product for India, 1981–2024
Why the Water Hidden in Soil Matters
For millions of farmers across India, a good harvest depends on something they cannot see directly: the water stored in the ground beneath their feet. This hidden water in the roots’ reach keeps crops alive between rains, shapes how heat waves feel, and influences whether a dry spell turns into a devastating drought. Until now, India has lacked a long, detailed record of this underground moisture. The study described here fills that gap by creating a daily map of root-zone soil moisture for all of India from 1981 to 2024, opening new possibilities for smarter farming, better drought warnings, and clearer views of how the climate is changing the land.
Looking Below the Surface
Most satellite missions can only sense moisture near the land’s surface, a few centimeters deep—too shallow to show what plant roots actually experience. These satellite records also only go back about a decade, making it hard to understand long-term trends. At the same time, computer models that simulate water movement in soil and rivers can run for many decades, but they often miss local details and may not fully capture the true amount of water in the ground, especially in places with heavy irrigation, complex terrain, or dense vegetation. The researchers set out to combine the strengths of both approaches to reconstruct how wet or dry the root zone (down to one meter) has been across India for more than four decades.
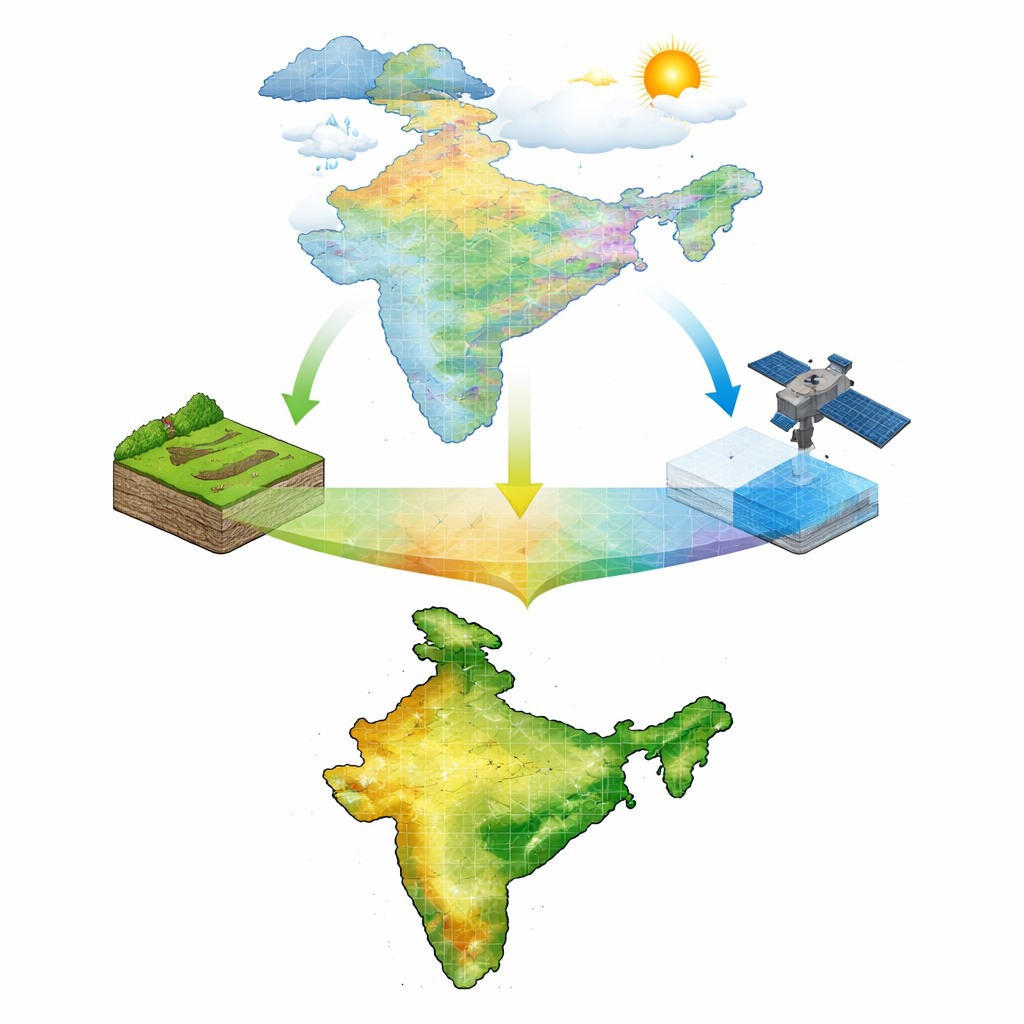
Blending Satellites, Models, and Weather
The team began with a high-resolution weather data set for India, including daily rainfall and temperature, corrected to match ground-based observations. They fed these data into a detailed land-surface and river-flow model called H08, which simulates how water runs off, sinks into the soil, and returns to the air through evaporation and plant transpiration. This produced long daily records of runoff, evapotranspiration, and soil moisture for every 0.05° grid cell—roughly a few kilometers on a side—across India’s major river basins. However, while the model captured patterns over time well, it tended to underestimate how much water was actually stored in the soil, especially in wetter regions. To correct this, the researchers brought in root-zone soil moisture from a NASA satellite-based product (SMAP Level 4), available from 2015 onward, and used it as a trusted reference.
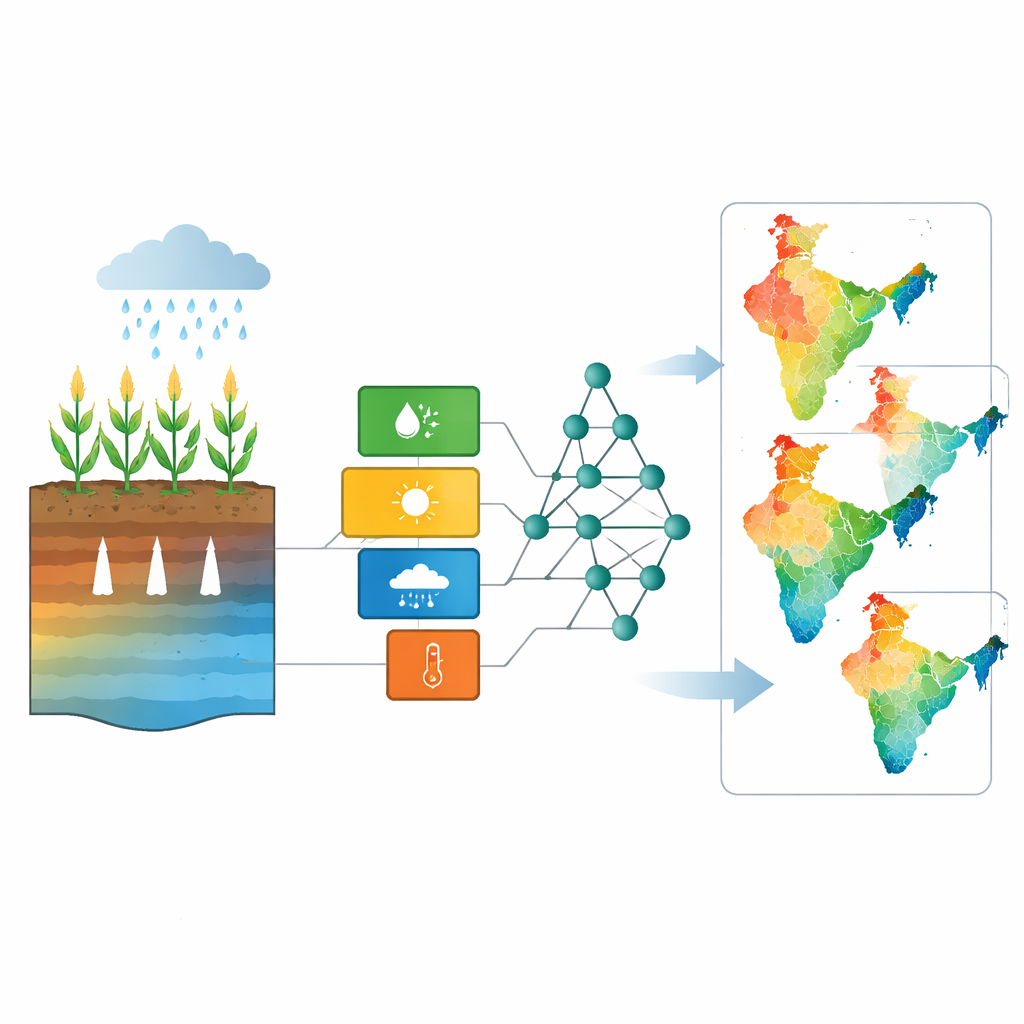
Teaching a Model to Think Like a Satellite
To bridge the gap between short-term satellite observations and long-term model output, the scientists turned to machine learning. For each grid cell across India, they trained a Random Forest model—a type of decision-tree ensemble—to learn the relationship between four inputs and the satellite-based root-zone soil moisture: modelled soil moisture, modelled evapotranspiration, the previous week’s rainfall, and daily air temperature. By focusing on each grid separately, the method preserved local differences in climate, soils, and land use. Once trained on the 2016–2024 period, the machine-learning system was used to “backcast” daily soil moisture all the way to 1981, generating a continuous 44-year record that is both physically consistent and tuned to match what the satellite would have seen.
Checking the New Map Against Reality
Any such reconstruction is only useful if it matches real-world behavior, so the team rigorously tested their product. First, they checked how well the H08 model reproduced river flows and evaporation measured by satellites, finding generally good agreement across hundreds of gauging stations. Then they evaluated the machine-learning soil moisture against SMAP itself: in most of India, the new product tracked the satellite very closely, with small errors and strong correlations. At a test site with in-ground sensors at multiple depths, the reconstructed root-zone moisture matched observations with high accuracy, despite the difference between a point measurement and a larger grid cell. Finally, they compared the soil moisture anomalies during two infamous drought years, 2002 and 2009, with independent satellite measurements of plant activity (solar-induced chlorophyll fluorescence). The dry patterns in soil and vegetation lined up well, showing that the new data set captures the way crops and natural plants respond to water stress.
What This Means for Farmers and Planners
The end result is a public, daily, grid-based map of how much water has been stored in the top meter of soil across India from 1981 to 2024. For non-specialists, this means a new foundation for answering practical questions: How unusual is this year’s dryness compared with past decades? Which districts are most vulnerable to crop losses during weak monsoons? How have irrigation and changing rainfall shaped underground water over time? While the authors caution that the data are less reliable in snowy mountains and some heavily irrigated areas, they emphasize that this long, detailed record can already support better drought monitoring, more realistic crop and water models, and more informed policies for food and water security in a warming world.
Citation: Chuphal, D.S., Abhishek, Kushwaha, A.P. et al. Development of Gridded Root-Zone Soil Moisture Product for India, 1981–2024. Sci Data 13, 560 (2026). https://doi.org/10.1038/s41597-026-06940-x
Keywords: soil moisture, drought, India, remote sensing, agriculture