Clear Sky Science · en
Future global annual frozen ground distribution datasets based on Frost Number Model with Kappa coefficient
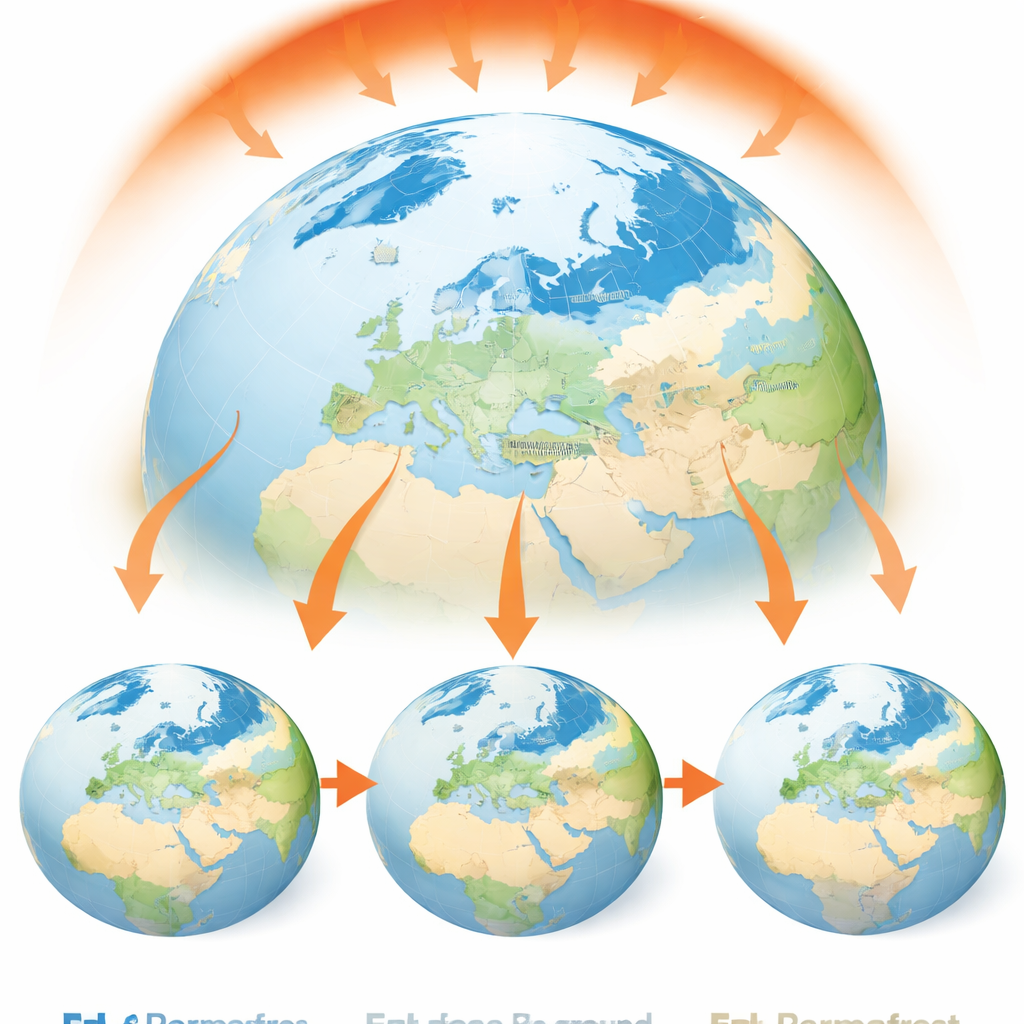
Why the Frozen Ground Beneath Our Feet Matters
Far below the snow and tundra of the Arctic, and high in mountain ranges from the Himalayas to the Andes, lies ground that stays frozen year after year. This hidden layer, called frozen ground, locks in water, shapes landscapes, supports buildings and roads, and stores massive amounts of carbon. As the planet warms, this frozen foundation is beginning to thaw, with consequences for ecosystems, infrastructure, and climate. The study summarized here delivers one of the most detailed forecasts to date of how Earth’s frozen ground will change over the rest of this century, giving scientists, planners, and communities a clearer look at what lies ahead.
A Closer Look at the World’s Frozen Ground
Frozen ground is not all the same. Some soil or rock remains frozen continuously for at least two years or more, while other regions freeze and thaw with the seasons, and still others freeze only briefly. Together, these forms of frozen ground currently cover a huge fraction of the land surface in the Northern Hemisphere, including Siberia, Alaska, northern Canada, the high Tibetan Plateau, the Alps, and parts of the Andes. When this frozen ground changes, it can disrupt local water supplies, destabilize hillslopes and buildings, and unlock ancient carbon that may further warm the climate. Yet predicting exactly where frozen ground will persist or vanish has been difficult, because it depends on subtle details of temperature over the whole year, not just how cold winters get.
Building a Better Thermometer for the Underground
The authors address this challenge by refining a relatively simple but powerful tool known as the Frost Number Model. Instead of simulating every physical process in the soil, this model uses how long and how strongly the air stays below or above freezing each year to estimate whether the ground beneath stays frozen. A key ingredient is a numerical cutoff, or threshold, that decides when a location counts as permanently, seasonally, or only briefly frozen. Past studies often chose this threshold somewhat arbitrarily, which limited accuracy. In this work, the researchers systematically tested many possible threshold values against modern, high‑resolution maps of frozen ground built from satellites, field measurements, and other data. They used a statistical measure called the Kappa coefficient to find the thresholds that best matched reality, separately tuning them for high‑latitude regions and high mountain regions, and for the three main frozen‑ground categories.
From Climate Models to Detailed Maps of the Future
Once the best thresholds were identified, the team turned to climate projections from the latest generation of global models (CMIP6). Rather than using the raw model output, they relied on a carefully corrected and downscaled dataset that provides daily air temperatures on a fine global grid, about one quarter of a degree in resolution. From 1950 through 2099, they computed yearly freezing and thawing indices at each grid cell, converted them into a frost indicator, and then classified each location as perennially frozen, seasonally frozen, intermittently frozen, or unfrozen. They repeated this process under four different future scenarios, ranging from strong emissions cuts and climate action to a high‑emissions pathway with limited mitigation, creating a full set of annual global maps that are now publicly available.
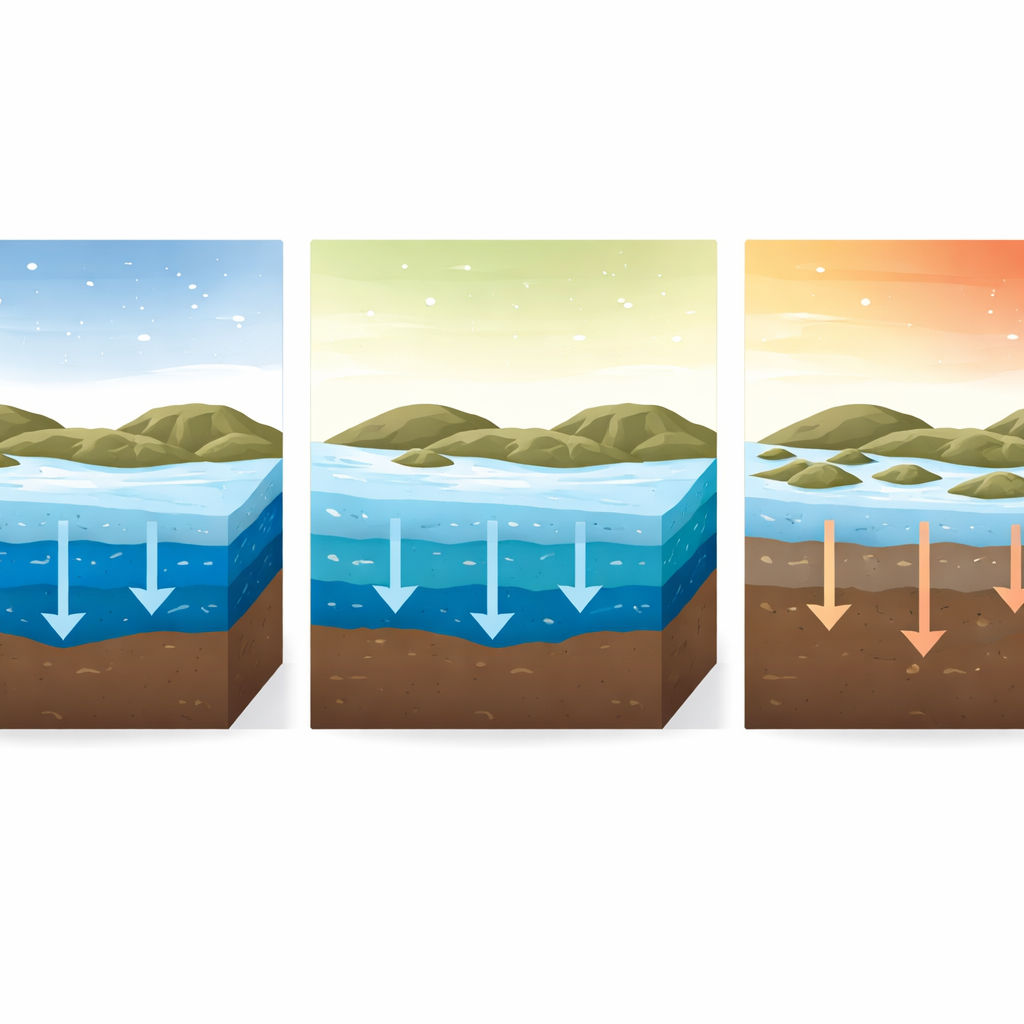
What the Maps Reveal About a Warming World
The resulting picture is stark. No matter which future pathway is considered, areas underlain by long‑lasting frozen ground shrink markedly over the century, while regions that freeze only seasonally or briefly expand. By the middle of the century, between about one‑fifth and nearly one‑third of today’s long‑frozen terrain is projected to thaw, depending on the scenario. By late century, losses grow even larger: under the highest‑emissions path, around three‑fifths of global perennially frozen ground disappears. The most dramatic changes occur along the southern edges of today’s Arctic permafrost belt and in high mountain regions such as the Tibetan Plateau, where much of the long‑frozen ground is transformed into only seasonally frozen soil. Lower‑emissions scenarios still show substantial losses, but the pace of retreat is slower and the remaining frozen areas are larger.
Using the New Maps to Prepare for Change
To ensure that their approach is trustworthy, the authors compared their historical reconstructions to several independent frozen‑ground maps for Russia, Canada, and the wider Arctic, finding strong agreement in both area and spatial patterns. Because the resulting dataset spans the entire globe at relatively high resolution and covers 150 years, it can now serve as a common reference for many kinds of studies. Hydrologists can use it to explore how river flow and groundwater might shift; ecologists can examine how changing freeze–thaw patterns affect vegetation and wildlife; engineers can identify where roads, pipelines, and buildings are most at risk; and climate scientists can better estimate how much carbon might be released from thawing soils. For non‑specialists, the main message is clear: frozen ground is not a distant curiosity under polar tundra. It is a fragile, climate‑sensitive foundation of our planet that is already changing, and our choices about future emissions will strongly influence how much of it we keep.
Citation: Pan, X., Li, H. & Nie, X. Future global annual frozen ground distribution datasets based on Frost Number Model with Kappa coefficient. Sci Data 13, 561 (2026). https://doi.org/10.1038/s41597-026-06918-9
Keywords: permafrost, frozen ground, climate change, Arctic warming, Tibetan Plateau