Clear Sky Science · en
A dataset for machine learning model to convective initiation detection and nowcasting over southeastern China
Why the Birth of Storms Matters
Sudden cloudbursts, destructive hail, and fierce thunderstorm winds can upend daily life within minutes. The key to better warnings is spotting the very first spark of a storm—when a small pocket of rising warm, moist air turns into a growing thundercloud. This study introduces a new, carefully curated dataset designed to help artificial intelligence (AI) learn to recognize and forecast that spark, known as convective initiation, over southeastern China.
Watching Storms from Sky and Ground
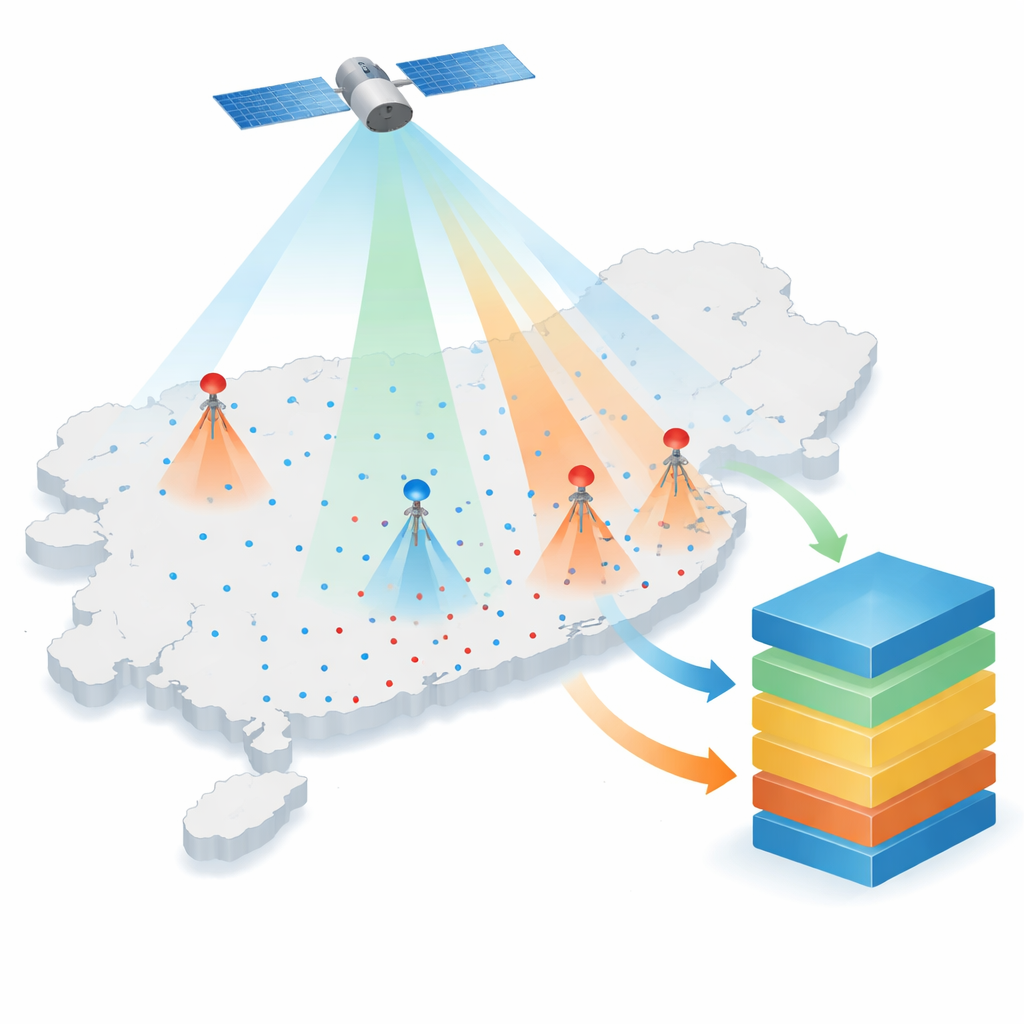
The researchers focus on a region of southeastern China heavily influenced by the East Asian monsoon, where severe thunderstorms frequently strike from March to September. To monitor the atmosphere in detail, they combine information from two main observing systems. On the ground, more than 150 weather radars scan the sky, measuring the strength and structure of rain and hail. At the same time, the Fengyun-4A geostationary satellite watches from space, recording how clouds reflect and emit light across several wavelengths. Together, these instruments provide a time-lapse view of storm birth and growth every 10 minutes over an area spanning thousands of kilometers.
Building a Library of Dangerous Weather
To teach AI, you first need examples. The team started by identifying many real episodes of hazardous weather—periods with intense rainfall, damaging winds, or hail—reported at over 1,000 ground stations between 2018 and 2023. They grouped overlapping events into broader regional outbreaks and then sliced each outbreak into 10-minute snapshots. For every snapshot, they stored a rich set of “feature” data: radar maps that show where and how strongly it is raining, plus satellite measurements that hint at cloud height, temperature, and structure. This process produced 829 regional events and 136,728 time samples, forming a large, diverse library of situations when storms either did or did not form.
Teaching Machines Where a Storm Is Born
Identifying the exact moment and place where a storm first appears is not straightforward. The researchers used radar mosaics—combined images from many radars—to find small areas where echoes first exceed a certain strength, signaling the birth of a new convective cell. They then estimated how each cell moved using an optical flow method, which tracks patterns in the radar images over time. By checking where echoes were in the previous and following 10-minute scans, the algorithm can decide whether a cell truly just formed (a genuine initiation) or is simply a continuation, a moving part of an older storm, or even a false echo caused by radar interference. Suspect cases were further screened with manual review to remove lingering technical artifacts.
Labeling Storms That Fizzle or Flourish
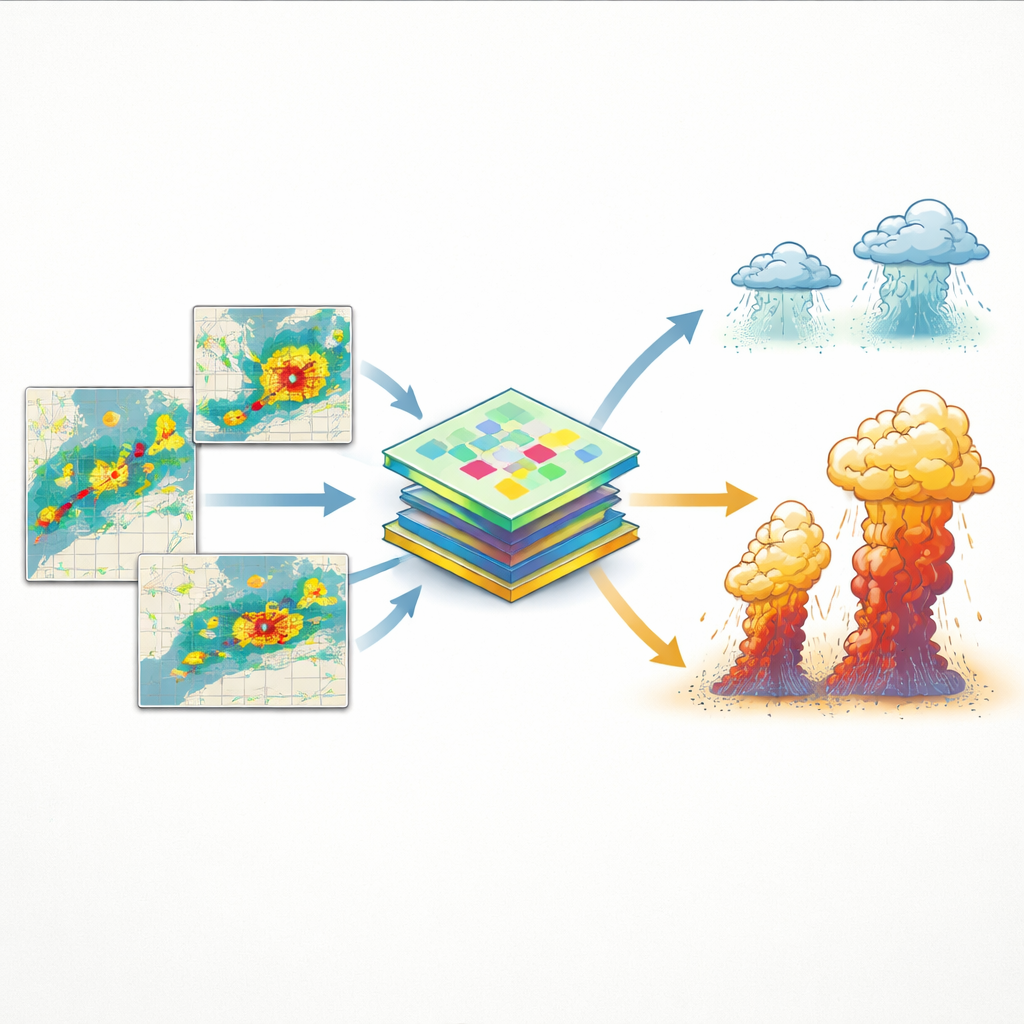
Once convective cells were identified, the next step was to classify their future behavior. For each newborn cell, the team followed its changes over the next 30 minutes, measuring how its area and radar intensity evolved. If the cell consistently grew larger and stronger, it was labeled as a “developing” initiation, meaning it had the potential to become a serious storm. If it weakened, disappeared, or failed to grow, it was labeled as “declining.” In total, the dataset contains more than four million initiation cells, of which about 43 percent are developing. These labels can be represented as simple outlines and pixel masks on the radar grid, making them easy targets for machine learning models that aim to predict not just where a storm will start, but whether it will become dangerous.
How and Where Storms Tend to Start
By counting how often initiation occurs in different places and at different times of day, the dataset also reveals patterns in storm behavior. Areas with frequent convective initiation line up well with regions of heavy rainfall, especially along coastal provinces and south of the Yangtze River, where warm, moist air supports frequent thunderstorms. The timing of initiation shows clear daily rhythms: in many areas, new storms most often appear in the afternoon, while some inland basins show peaks around midnight with secondary afternoon maxima. These patterns are consistent with previous studies of larger storm systems, suggesting that the new algorithm is capturing realistic storm birth behavior rather than random noise.
What This Means for Future Weather Warnings
For non-specialists, the central message is simple: this work delivers a high-quality training ground for AI systems that aim to spot the earliest signs of severe thunderstorms. By combining dense radar networks, advanced satellite imagery, and careful classification of storm birth and growth, the CIDS dataset gives machine learning models both the raw pictures and the correct answers they need to learn. In the long run, smarter models built on this dataset could translate into earlier and more reliable warnings for flash floods, damaging winds, and hail, buying communities precious time to prepare.
Citation: Liu, Y., Xiong, A., Liu, N. et al. A dataset for machine learning model to convective initiation detection and nowcasting over southeastern China. Sci Data 13, 557 (2026). https://doi.org/10.1038/s41597-026-06902-3
Keywords: thunderstorm prediction, weather radar, satellite meteorology, machine learning, severe convection