Clear Sky Science · en
A high-resolution boundary current product from Gridded Observations of eXpendable BathyThermograph (XBT) transects
Why These Ocean Highways Matter
Powerful ribbons of water race along the edges of our oceans, moving vast amounts of heat and salt around the planet. These boundary currents—like the Gulf Stream and the Kuroshio—shape storms, sea level, and marine heatwaves that affect coastal communities, fisheries, and global climate. This paper describes a new, openly available data product that turns decades of ship-based temperature measurements into sharp, easy-to-use maps of five of these major currents, giving scientists a clearer view of how they behave and change over time. 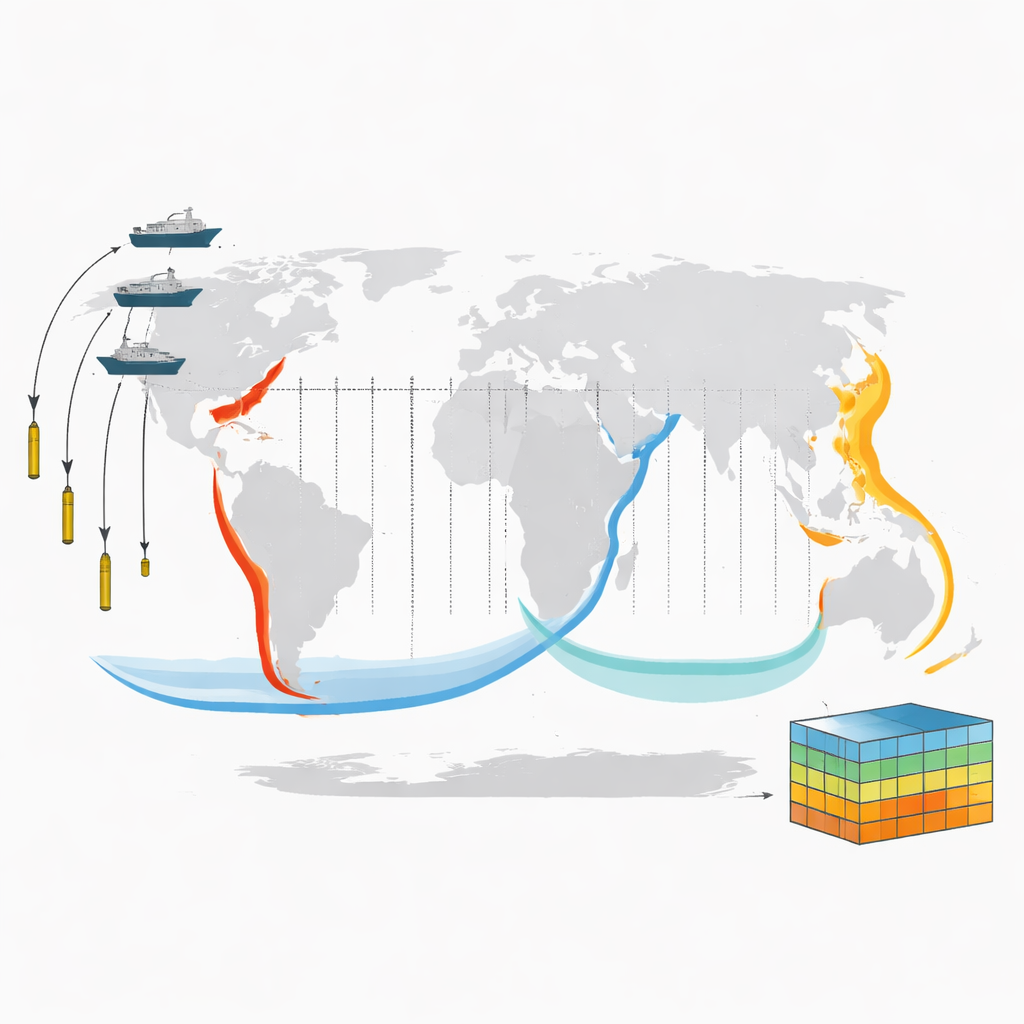
Taking the Ocean’s Temperature from Passing Ships
Instead of relying only on dedicated research cruises, an international network uses "ships of opportunity"—commercial and other working vessels—to drop simple probes called expendable bathythermographs into the sea. Each probe falls through the upper 800 meters of the water, recording how temperature changes with depth. Over more than 50 years, this network has collected millions of such profiles, especially along repeat routes that slice across strong currents. The result is a uniquely dense, long-term record that captures the sharp temperature contrasts at current fronts and how these ocean highways vary from season to season and decade to decade.
From Raw Profiles to Detailed Ocean Slices
The authors focus on five key routes that cut across major boundary currents: the Gulf Stream and Brazil Current in the Atlantic, the Kuroshio and East Australian Current in the Pacific, and a path through the Antarctic Circumpolar Current south of New Zealand. They first clean the data, removing questionable measurements and averaging together profiles that are very close together. Then they interpolate the temperature readings onto a regular grid every 0.1 degrees along the track and every 2 meters in depth. Because the probes measure only temperature, the team uses relationships learned from other instruments to estimate salinity, and then combines temperature and salinity to infer water density. With density, they can apply physical balances that relate pressure gradients and Earth’s rotation to estimate the speed and direction of the currents.
Sharpening the Picture of Ocean Currents
The resulting product, called GOXBT, provides high-resolution sections of temperature, salinity, and absolute current velocity for each crossing of these routes over many years. Compared with a widely used, lower-resolution product built mainly from free-drifting Argo floats, the new gridded sections reveal boundary currents that are stronger, narrower, and more finely structured. Features like the sharp north wall of the Gulf Stream, the layered flows of the Brazil Current system, the energetic eddies of the East Australian Current and Kuroshio Extension, and the multiple jets of the Antarctic Circumpolar Current all stand out more clearly. This sharper view is crucial for checking how well climate and forecasting models reproduce real ocean behavior and for understanding how currents influence coastal sea level and marine heatwaves.
Testing Against Satellites and Other Observations
To ensure the new product is trustworthy, the authors compare their estimated salinity with an independent Argo-based dataset and find small typical differences, especially below the surface layers where freshening from rain or ice melt can complicate things. They also compare current speeds and volume transports with values inferred from satellite measurements of sea surface height, which track the tilt of the ocean surface caused by flowing water. Across all five routes, the time series from GOXBT and from satellites match closely, with correlations above 0.7 and even above 0.9 for the Antarctic Circumpolar Current. This agreement shows that the gridded ship-based data capture both short-lived eddies and longer climate swings in the strength of these currents. 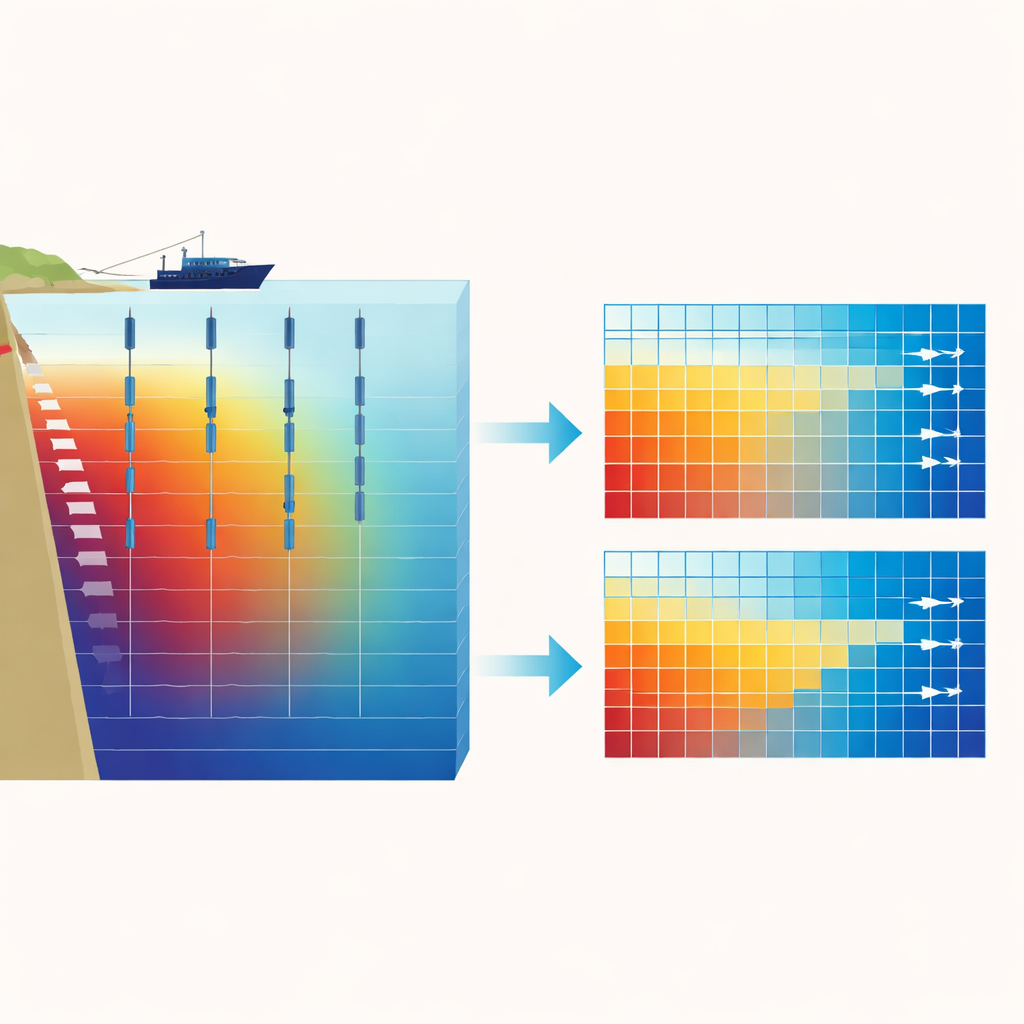
A New Tool for Tracking a Changing Ocean
In plain terms, this work turns scattered temperature casts from passing ships into precise, long-running cross-sections of some of the planet’s most important ocean currents. By openly sharing these gridded data, the methods, and the code, the authors provide a new backbone for testing ocean models, refining sea level and heat transport estimates, and studying extreme events like marine heatwaves. As more routes and regions are added, GOXBT will help scientists track how the ocean’s great highways are shifting in a warming world, and what that means for weather, coasts, and climate.
Citation: Goes, M., Dong, S., Cowley, R. et al. A high-resolution boundary current product from Gridded Observations of eXpendable BathyThermograph (XBT) transects. Sci Data 13, 660 (2026). https://doi.org/10.1038/s41597-026-06883-3
Keywords: ocean currents, boundary currents, XBT data, climate variability, satellite altimetry