Clear Sky Science · en
TSA-MC v1.0: A 30-m dataset of true surface area for China’s mountains to support SDG 15.4 indicators monitoring
Why Mountain Area Really Matters
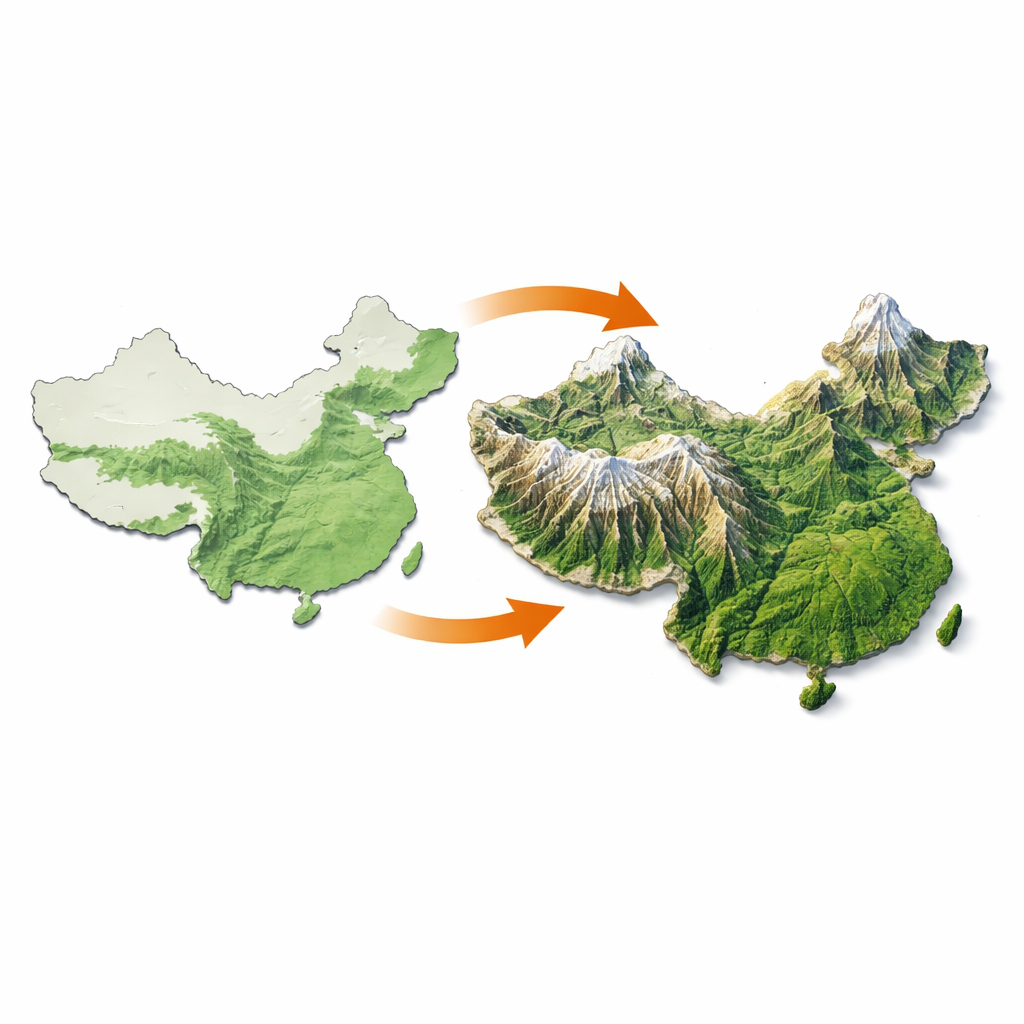
Mountains may look like simple shapes on a flat map, but in reality they are crumpled, folded landscapes that hide a lot of extra surface. That hidden area is not just a geometric curiosity: it helps determine how much forest a country really has, how much carbon its land can store, how quickly soil may erode, and even how much freshwater runs off the slopes. This article introduces a new, openly available map for China that measures the true three-dimensional surface area of its mountains in fine detail, giving scientists and policymakers a much more realistic picture of these vital regions.
Seeing Beyond Flat Maps
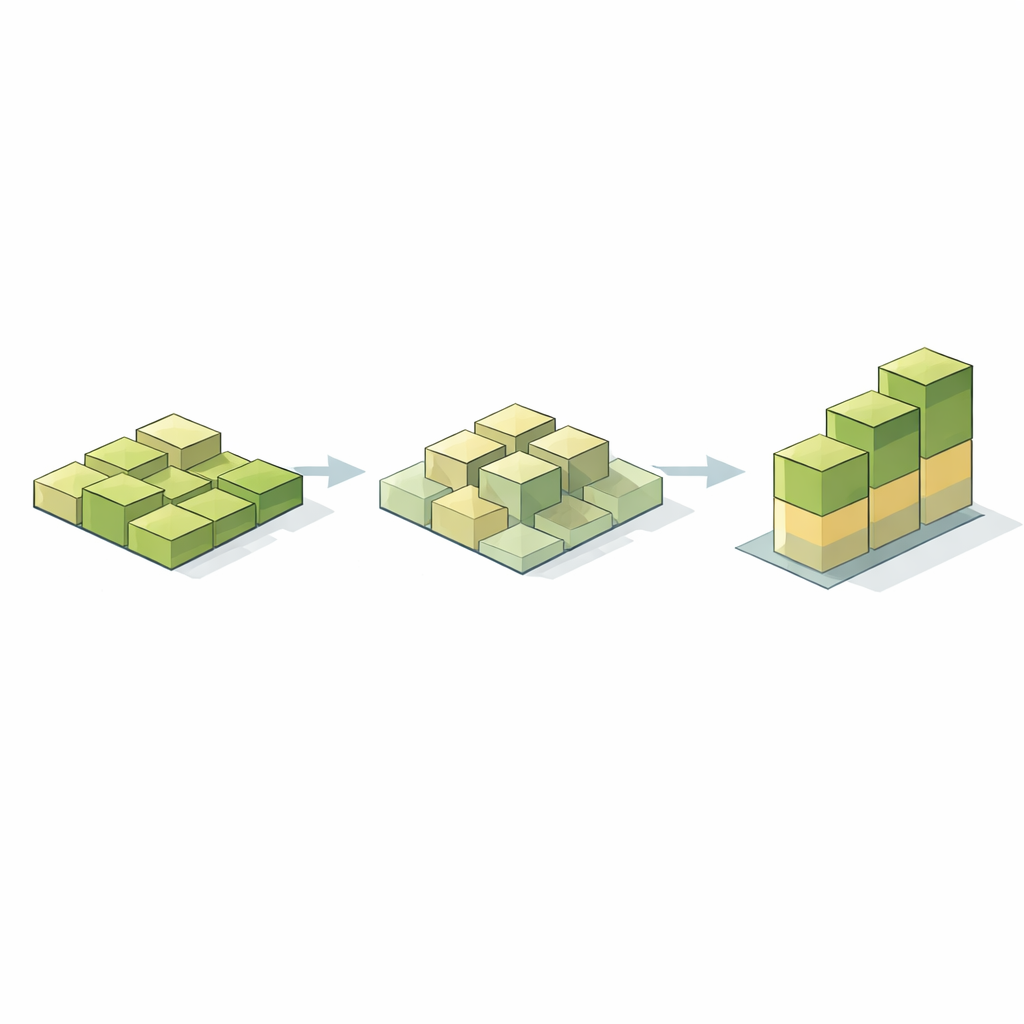
Most official statistics about land are based on what cartographers call “projected area” – the flat footprint a landscape casts onto a map. That works reasonably well for plains, but it breaks down in steep mountain ranges. A sloping hillside is like a ramp laid on the floor: its actual surface is longer than its shadow, so a flat map quietly undercounts how much land is really there. Earlier global work showed this can change key sustainability indicators, such as the fraction of mountain slopes covered in vegetation, by more than ten percent. Because mountains are crucial for biodiversity, water supply, and climate regulation, those hidden errors ripple into how we track progress on United Nations goals for protecting life on land.
Building a Truer Picture of China’s Mountains
China is an ideal and urgent test case: about two-thirds of the country is officially classed as mountainous, and these regions underpin ecological security for hundreds of millions of people. However, earlier techniques for measuring true surface area were either too computationally heavy to run over an entire country, or too uncertain to trust across very different landforms. The authors solve this by starting from a widely used satellite-based elevation model and slicing the mountainous terrain into a grid of 30-by-30 meter squares. For each square, they examine how its height compares with those of its eight neighbors and then break the surface into a set of tiny triangles. Adding up the area of those triangles yields a physically realistic measure of how much ground is actually present, slope and roughness included.
What the New Map Reveals
The resulting dataset, called TSA-MC v1.0, shows that China’s mountains are substantially larger than their flat-map footprint suggests. When the authors compared their three-dimensional measure with traditional projected area, they found an extra 582,000 square kilometers of mountain surface—more than the land area of Spain. This pushes the estimated share of mountainous terrain in China from about 65 percent to over 67 percent. The increase is far from uniform: the rugged Qinghai–Tibet Plateau accounts for nearly half of the newly recognized area, while gentler eastern ranges show smaller gains. By summarizing results for provinces, major mountain regions, and official terrain types, the team also quantified how the “roughness” of the land rises with slope and peaks in very high, heavily dissected ranges.
Testing Real-World Use With Green Cover
To show that this is more than a mathematical exercise, the authors tested how the new surface map changes an important ecological indicator: how much of the mountains are covered by “green” land such as forests, shrubs, grasslands, and croplands. On the Tibetan Plateau, they combined their true-area grid with a detailed land-cover map to recalculate a mountain green cover index. The overall average shift was modest, but the differences varied sharply from place to place. In steep, forested valleys, where vegetation hugs the most inclined slopes, the corrected index rose because the vegetation actually occupies more true surface than the flat map implied. On broad, high plateaus where plants favor gentler ground, the index sometimes fell slightly. These contrasting patterns confirm that the new dataset can pick up subtle but important links between terrain and ecosystems.
Limits, Uses, and What Comes Next
The authors stress that their product is best thought of as a high-quality, conservative baseline. It still inherits some uncertainty from the underlying elevation data and cannot capture every tiny ridge or gully at 30-meter resolution, so the true land area is likely slightly higher still. Even so, TSA-MC v1.0 already offers a powerful tool for improving models of water flow, soil loss, and solar energy, and for revising area-based statistics such as forest carbon stocks or pasture capacity. Because the dataset and its documentation are openly shared, researchers and agencies can plug it directly into their own analyses. In plain terms, this work shows that China’s mountain skin is larger and more varied than flat maps reveal—and that counting that extra surface can sharpen our understanding of how these landscapes support life, climate, and sustainable development.
Citation: Bian, J., Wang, Y., Zhao, J. et al. TSA-MC v1.0: A 30-m dataset of true surface area for China’s mountains to support SDG 15.4 indicators monitoring. Sci Data 13, 626 (2026). https://doi.org/10.1038/s41597-026-06880-6
Keywords: mountain surface area, China topography, digital elevation model, sustainable development goals, mountain ecosystems