Clear Sky Science · en
Individual Brain Charting: fifth release of high-resolution fMRI data for cognitive mapping
Why This Brain Mapping Project Matters
The human brain is often compared to a universe inside our heads, yet most brain scans show only a tiny slice of what it can do. The Individual Brain Charting (IBC) project tackles this problem by scanning the same people again and again while they perform many different mental tasks. This new fifth data release adds another large block of information about how we think, feel, decide, and move, turning each participant’s brain into a richly detailed “map” of their mind in action.
Building Detailed Maps of Individual Minds
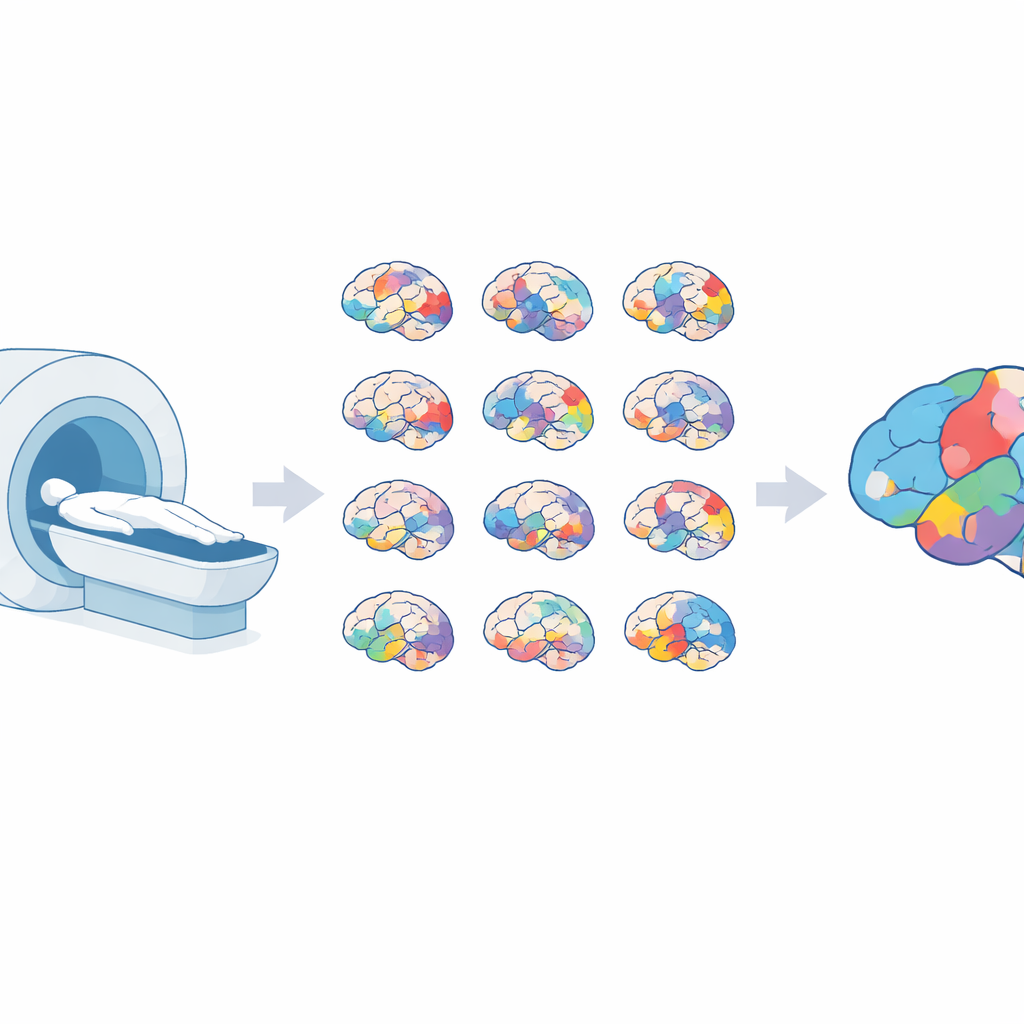
Traditional brain studies usually scan many volunteers only once or twice, averaging their results. That approach is helpful, but it blurs the fine-grained differences between individuals. The IBC project takes a different route: it follows a small group of people across years, collecting up to 40 hours of high-resolution functional MRI data per person so far, with a goal of 50 hours. All scans are taken on the same MRI machine, with the same procedures, at the same research center in France. By keeping the environment fixed and the tasks varied, the team can trace both what is common across brains and what is unique to each individual’s mental landscape.
Many Everyday Mental Skills in One Dataset
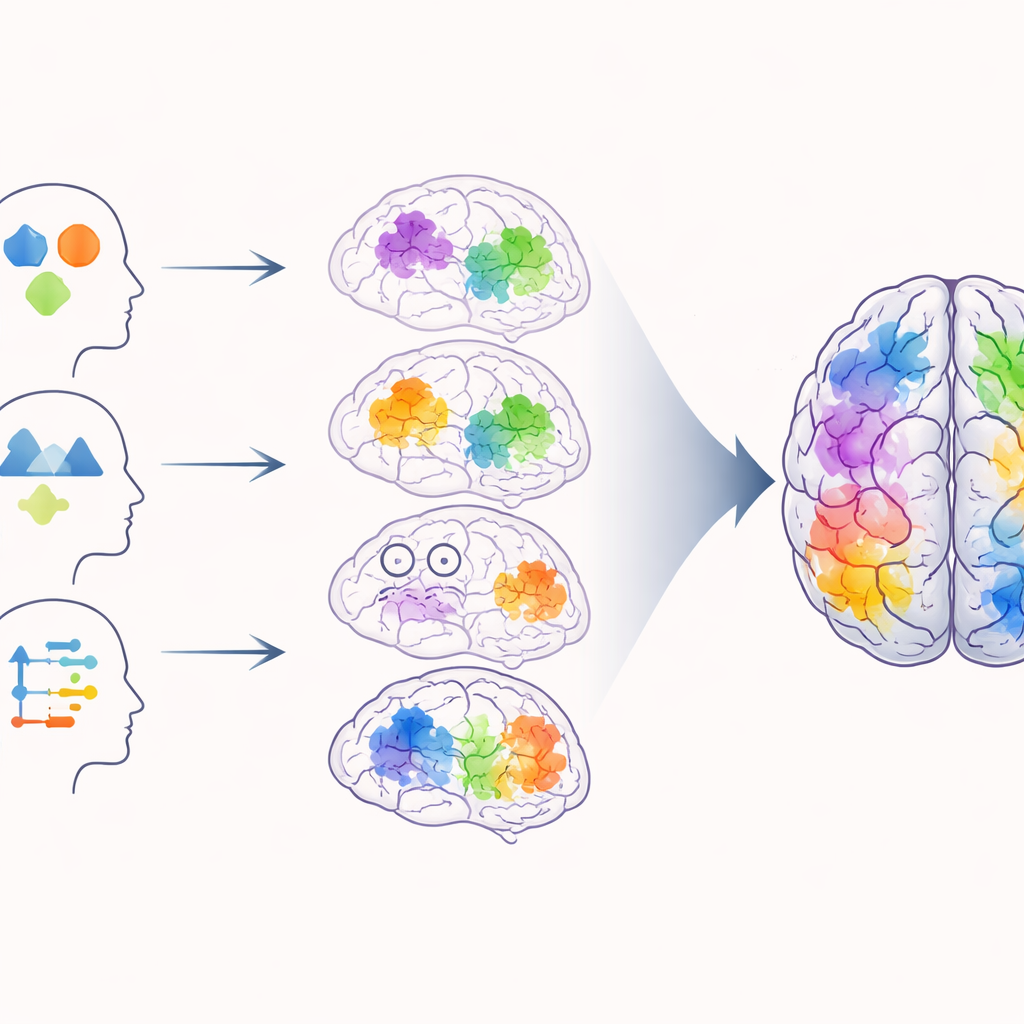
This fifth release adds 18 new tasks that touch a wide range of everyday abilities. Volunteers solve math and geometry facts, judge sentences about people’s beliefs, navigate a virtual historic town, watch moving dots that resemble walking figures, and recognize emotional faces. They also perform tasks measuring memory, quick reactions, self-control (stopping a planned movement at the last moment), and decision-making under risk and reward, including gambling-style choices with possible gains and losses. Some tasks come from well-known test batteries that study healthy aging, others from projects on reward learning or visual perception. Together they introduce new concepts such as loss aversion in decision-making, how we perceive body motion, how we imagine emotional scenes, and how we tell possible from impossible spaces.
From Raw Signals to Usable Brain Maps
Collecting the scans is only the first step. The team uses carefully standardized processing pipelines so that data from hundreds of runs can be meaningfully compared. Each brain image is corrected for distortions, aligned within the person, and then mapped onto a common reference brain. For every task, statistical models link changes in the MRI signal to specific events, like seeing a face or deciding whether to accept a gamble. The result is a large set of contrast maps—3D pictures that highlight where the brain responds more to one condition than another. The researchers also check quality rigorously, measuring signal-to-noise levels, head motion, and how much variation is explained by who the person is, what task they are doing, and how the images were acquired. They find that task conditions and individual identity strongly shape brain activity, while technical details of the scanner setup play a smaller role.
Open Data for a Shared Brain Atlas
All of the raw, preprocessed, and statistical data are openly shared through the EBRAINS platform, following a widely used standard for naming and organizing brain-imaging files. Researchers can download original scans, cleaned data, contrast maps, and detailed descriptions of each task, along with code for reproducing the analyses and even helper tools that simplify data access. By adding this new release to previous ones, the IBC project now covers 67 different tasks and more than 500 distinct comparisons of brain activity patterns, with future releases planned to extend into areas such as touch, color, abstraction, and video gaming.
What This Means for Understanding the Brain
For non-specialists, the message is simple: this project is building extremely rich, person-level maps of how the brain supports thought and behavior. Instead of a blurry, one-size-fits-all picture, the IBC data allow scientists to see which mental operations (like navigation, emotion, or number processing) show up in which brain regions for each individual, under many different conditions. Over time, combining these detailed maps across people and tasks should lead to better brain “atlases,” more reliable results, and a stronger foundation for studying how cognition changes with age, disease, or treatment. In short, the fifth IBC release is another major step toward a shared, high-definition reference for the thinking human brain.
Citation: Ponce, A.F., Aggarwal, H., Shankar, S. et al. Individual Brain Charting: fifth release of high-resolution fMRI data for cognitive mapping. Sci Data 13, 593 (2026). https://doi.org/10.1038/s41597-026-06869-1
Keywords: functional MRI, cognitive mapping, brain atlas, neuroimaging dataset, individual variability