Clear Sky Science · en
WHACS: An Improved Global Wave Hindcast for the Australian Climate Service
Why Big Waves Matter to Everyday Life
Coastal storms and powerful ocean waves are not just dramatic images on the evening news; they can damage homes, roads, ports, and vital services. Around Australia and across the Indo-Pacific, rising seas and changing storm patterns are expected to make coastal flooding and erosion more frequent. To prepare, planners and emergency agencies need a clear picture of how waves have behaved over past decades and how often truly extreme events occur. This article describes WHACS, a new long-term digital record of waves around the globe, built to give Australia and its neighbours a sharper, more reliable view of the ocean’s restless surface.
A New Long Look at the Ocean’s Waves
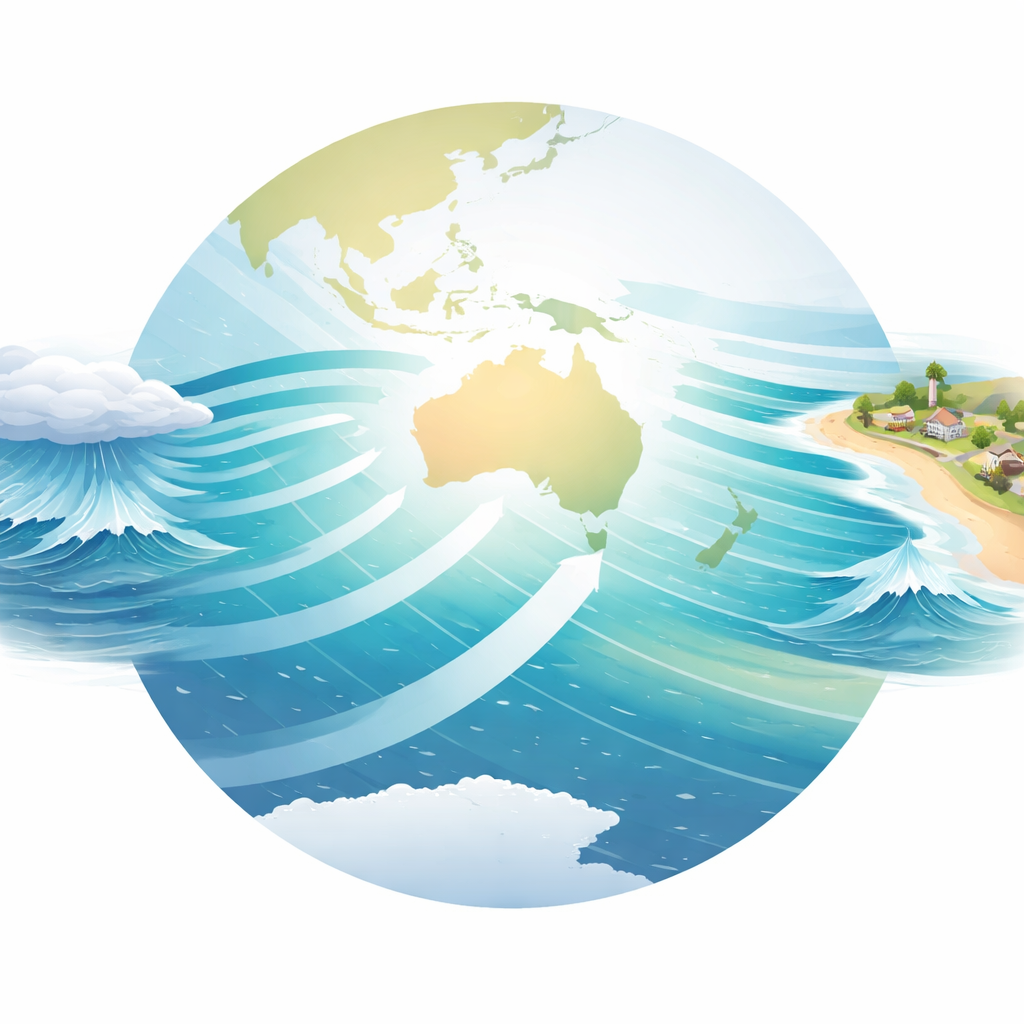
WHACS (Wave Hindcast for the Australian Climate Service) is a computer-built history of ocean waves from 1979 to the present, updated every month. Instead of relying only on scattered instruments at sea, the team uses a sophisticated wave model driven by global weather data to reconstruct what the sea state was like, hour by hour, almost everywhere on Earth. This makes it possible to examine long-term patterns and rare extremes that would be hard to capture with measurements alone. The dataset serves many users: coastal engineers designing seawalls, energy developers sizing wave power systems, climate researchers tracking trends, and emergency managers assessing risks to communities.
From Global Storms to Local Shores
To build WHACS, scientists ran the WAVEWATCH III model on a special kind of global grid that uses larger cells in the open ocean and smaller cells near coasts. This allows the model to follow long-traveling swells from distant storms into complex coastal areas without using a patchwork of separate regional models. The system is closely aligned with Australia’s operational wave forecast model so that the historical record and day-to-day forecasts are consistent. In addition to basic measures like wave height and period, WHACS stores more detailed information about how energy is spread across different wave directions and frequencies, especially around the Indo-Pacific islands and Australia’s continental shelf.
Sharpening the Picture of Extreme Events
Because coastal damage is often driven by the most powerful storms, the team put special effort into improving the model’s behaviour for extreme waves. They corrected a known tendency of the underlying weather data (the ERA5 reanalysis) to underestimate the strongest winds, which in turn would underplay the biggest waves. By carefully tuning wind corrections and wave physics, and then checking against satellite and buoy records, they found a configuration that boosts the largest waves without distorting the more common, moderate conditions. A case study of a destructive 2021 storm that sent huge swells toward southern Australia shows how the calibrated model now reproduces both the growth of waves along the storm’s track and the timing and size of the swells hitting the coast much more accurately.
Testing the Model Against the Real Ocean
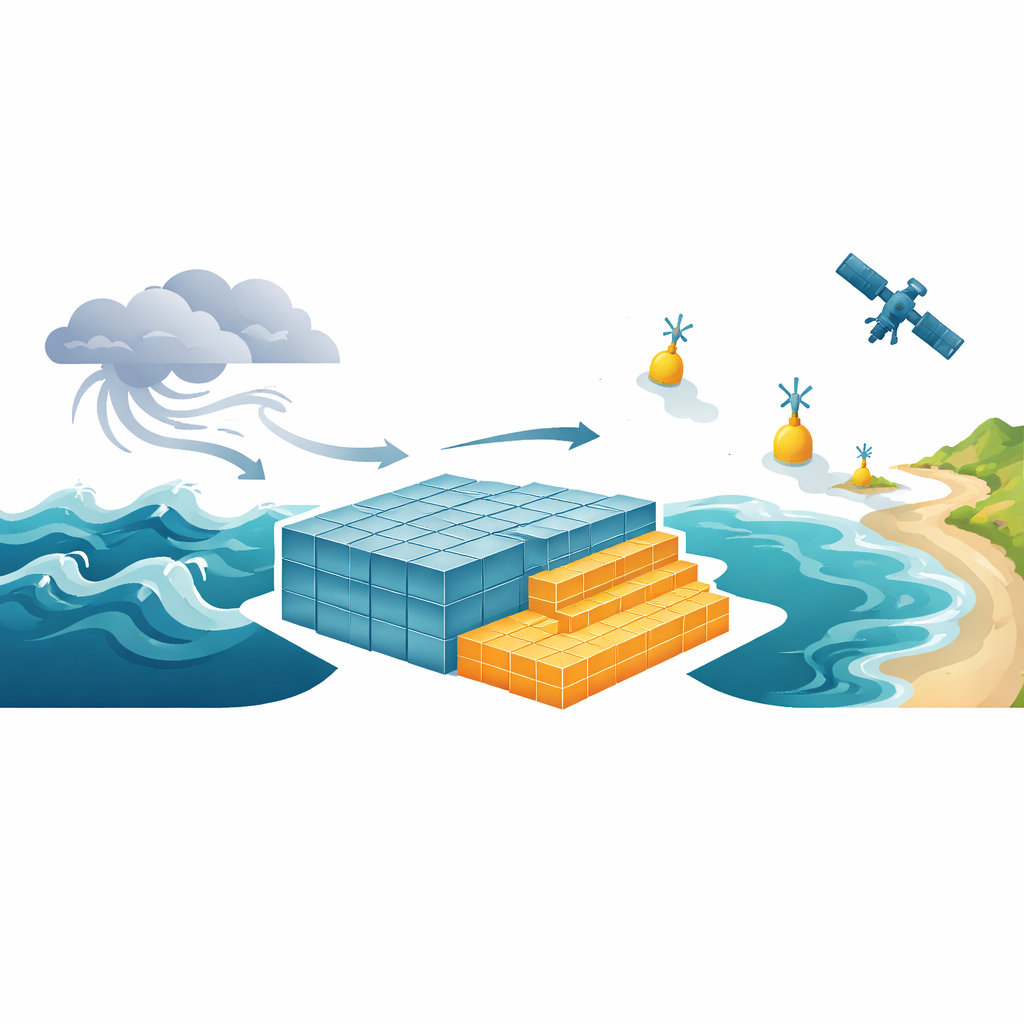
Building trust in a digital ocean requires rigorous checking. The authors compared WHACS wave heights with more than a decade of satellite altimeter data worldwide and with 35 years of wave buoy measurements around Australia. Overall, the model’s average error is small, with particularly strong agreement for open-ocean conditions. Some biases remain—for example, overestimation in parts of the Southern Ocean where ocean currents were not included, and mismatches near complex reefs like the Great Barrier Reef, where fine-scale underwater structures are poorly resolved. Even so, the model performs impressively well for a global system and clearly improves on the earlier CAWCR hindcast that WHACS replaces.
What This Means for Coasts and Communities
By providing a detailed, consistent, and regularly updated picture of the world’s waves, WHACS gives Australia’s climate service and its partners a solid foundation for understanding past coastal hazards and preparing for future ones. Planners can now explore how often damaging wave events have occurred, model how waves interact with tides and rising sea levels, and design more resilient infrastructure. While no model can perfectly capture every reef or shoreline, WHACS significantly narrows the gap between what we can measure directly and what we need to know to keep people and assets safe along the coast.
Citation: Smith, G., Meucci, A., Spillman, C. et al. WHACS: An Improved Global Wave Hindcast for the Australian Climate Service. Sci Data 13, 558 (2026). https://doi.org/10.1038/s41597-026-06864-6
Keywords: ocean waves, coastal hazards, climate risk, wave modelling, Australia