Clear Sky Science · en
A Forty-year regional-scale dataset of shoreline change and nearshore wave conditions in Southeast Australia
Why this coastline record matters
For millions of people living near the sea, the position of the beach – where land meets ocean – quietly shapes daily life, from where houses can be built to how roads and dunes withstand storms. Yet coastlines are constantly on the move under the push and pull of waves. This article presents a rare, forty‑year record of how more than 300 beaches along southeast Australia have shifted in response to changing wave conditions, giving scientists, planners, and communities a powerful new way to understand and prepare for coastal change.
Watching hundreds of beaches at once
Instead of tracking just a few well‑studied beaches, the authors assembled a regional picture of the entire New South Wales coast – over 1,000 kilometers of mainly sandy, wave‑dominated shore. They divided the coastline into more than 8,000 evenly spaced lines, or transects, each 100 meters apart and drawn straight from the land out to sea. Along every one of these lines, they measured how the shoreline has moved over four decades, and what the nearby waves were doing hour by hour. This combination turns the coast into a dense observing network rather than a handful of isolated monitoring sites.
Reading the shoreline from space
To see how the beach edge changed through time, the team relied on a stream of satellite images dating back to the 1980s. Using an open‑source toolkit, computer algorithms automatically separated sand from water in each image, traced the waterline, and then intersected it with the predefined transects. Because satellites capture the coast at different tide levels, the authors corrected each snapshot to a common reference sea level using information about the tide and the average steepness of the beach face. The resulting product is a bi‑weekly record, where possible, of shoreline position for each transect from 1984 to 2024, along with estimates of beach slopes. Comparisons with traditional on‑the‑ground surveys at 12 test beaches show that these satellite‑based shoreline positions typically fall within about 7 to 13 meters of field measurements, accurate enough to capture meaningful erosion and recovery patterns over seasons and years.
Rebuilding waves close to shore
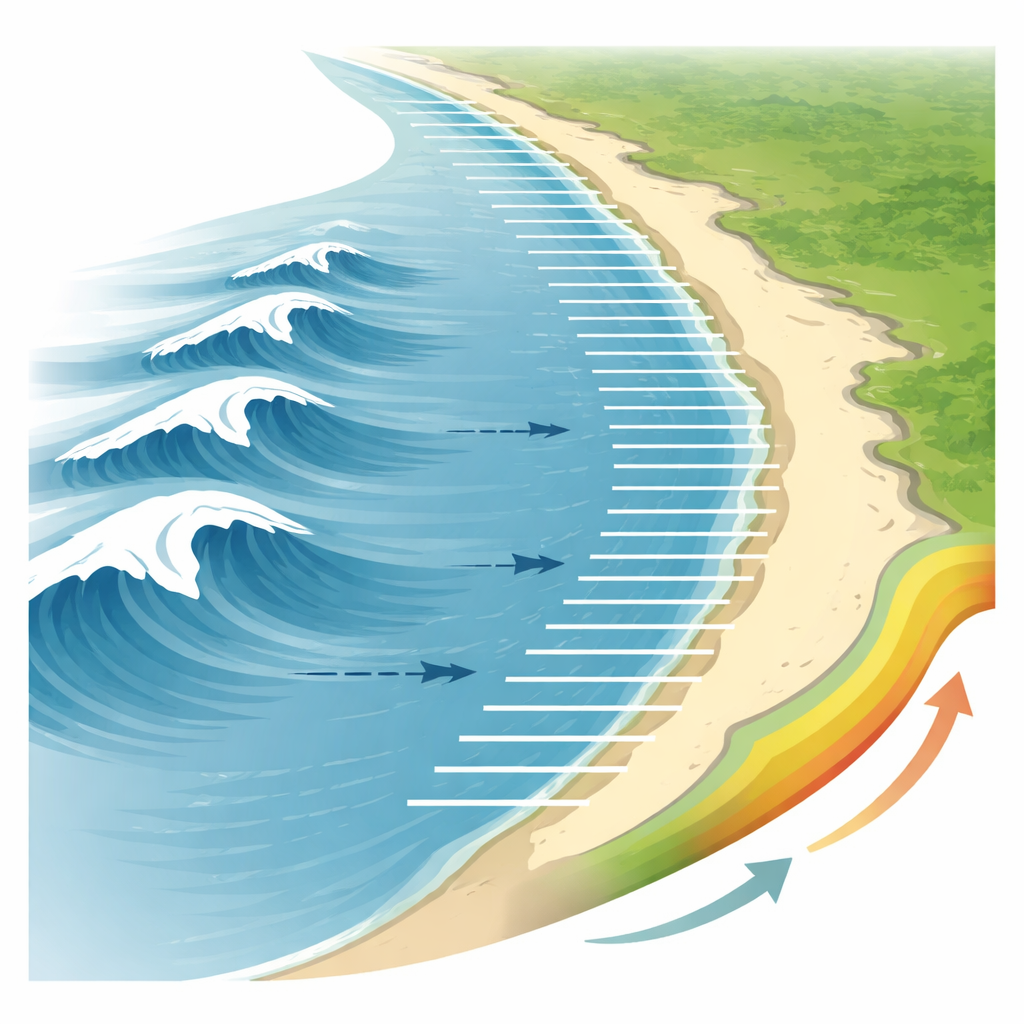
Knowing how the shoreline moves is only half the story; understanding why it moves requires information about the waves that shape it. Direct measurements from buoys exist only at a limited number of locations, so the authors worked from a global wave reanalysis that describes offshore conditions since 1979. They then applied an efficient two‑step approach, known as BinWaves, to transform these offshore waves toward the coast. First, they ran a coastal wave model many times to pre‑compute how waves of different heights, periods, and directions would travel from deep water into a nearshore zone about 10 meters deep along seven regional domains. Second, they used this library of responses to rapidly reconstruct hourly wave conditions at the 10‑meter contour in front of every transect for the full 45‑year period.
Checking the numbers against real waves
To test how well these modeled waves matched reality, the team compared them with observations from seven offshore buoys and nineteen nearshore buoys scattered along the coast. For wave height, the agreement was strong: typical differences were only a few tens of centimeters, and the ups and downs of storms and calmer spells were closely reproduced. Wave period and direction proved more challenging, partly because the offshore dataset groups energy into coarse frequency and direction bins, which blurs fine details. Even so, the reconstructed waves capture the main trends, with mean measures generally performing better than their “peak” counterparts. The authors document where uncertainties are largest – for example, near complex headlands or where wave direction changes rapidly – and provide extra information such as the distance from each transect to the 10‑meter contour so users can judge how representative the local wave estimates are.
How this dataset can be used
Together, the shoreline and wave records form a unified system: every transect has a time series of where the beach edge sat, the slope of the sand, and the waves arriving just offshore. Researchers can use either part alone – to explore long‑term changes in wave climate or in shoreline position – or combine them to unravel how different stretches of coast respond to similar storms and climate patterns. Because the dataset spans hundreds of beaches with consistent methods, it is especially valuable for testing whether models of shoreline change built at one site can be trusted elsewhere, and for training modern data‑hungry tools such as machine‑learning and hybrid physics‑based models. Coastal managers, in turn, can use the information to better assess erosion hotspots, consider future adaptation options, and contribute to early‑warning systems for storm impacts.
What this means for coasts in a warming world
The article does not predict exactly how any single beach will behave in the future. Instead, it delivers the raw material needed to make those predictions more reliable. By tying four decades of shoreline motion to the waves that drive it, across an entire region rather than a few famous sites, the authors have created a kind of “long‑term memory” for the coast of southeast Australia. As sea levels rise and storm patterns shift, this dataset offers a crucial benchmark for detecting unusual changes, refining coastal models, and supporting more informed decisions about how and where people live along the shore.
Citation: Mao, Y., Vos, K., Cagigal, L. et al. A Forty-year regional-scale dataset of shoreline change and nearshore wave conditions in Southeast Australia. Sci Data 13, 484 (2026). https://doi.org/10.1038/s41597-026-06859-3
Keywords: coastal erosion, shoreline change, wave climate, satellite monitoring, New South Wales beaches