Clear Sky Science · en
Global Intensity-Duration-Frequency curves based on observed sub-daily rainfall (GSDR-IDF)
Why sudden downpours matter
When heavy rain falls in just a few hours, streets can turn into rivers, drains overflow, and vital services shut down. Engineers and planners need to know how often such intense cloudbursts are likely to happen to design safe roads, bridges, and cities. Yet, until now, there has been no consistent, observation-based global picture of these short, sharp bursts of rain. This paper introduces a new global dataset that fills that gap, helping communities better understand and prepare for flash‑flood risks in a warming world.
Measuring the hardest rain on Earth
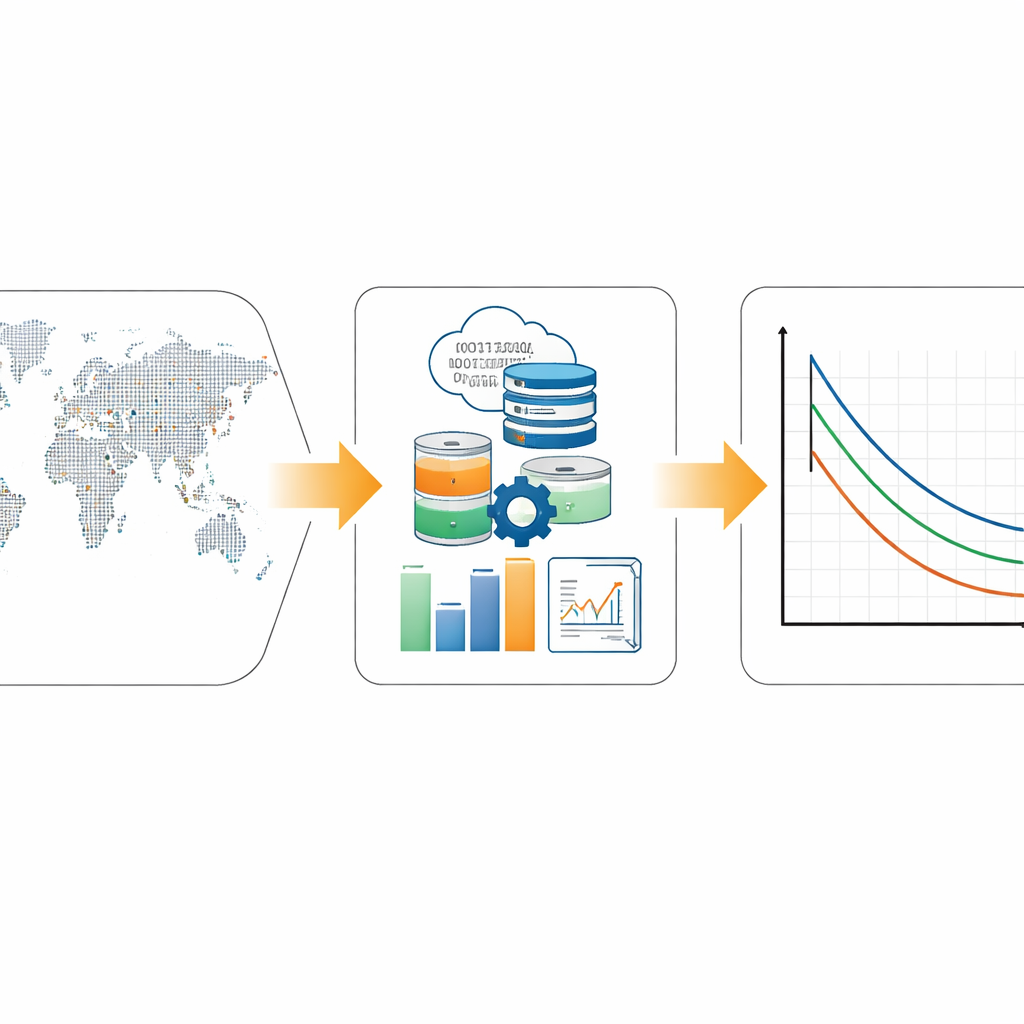
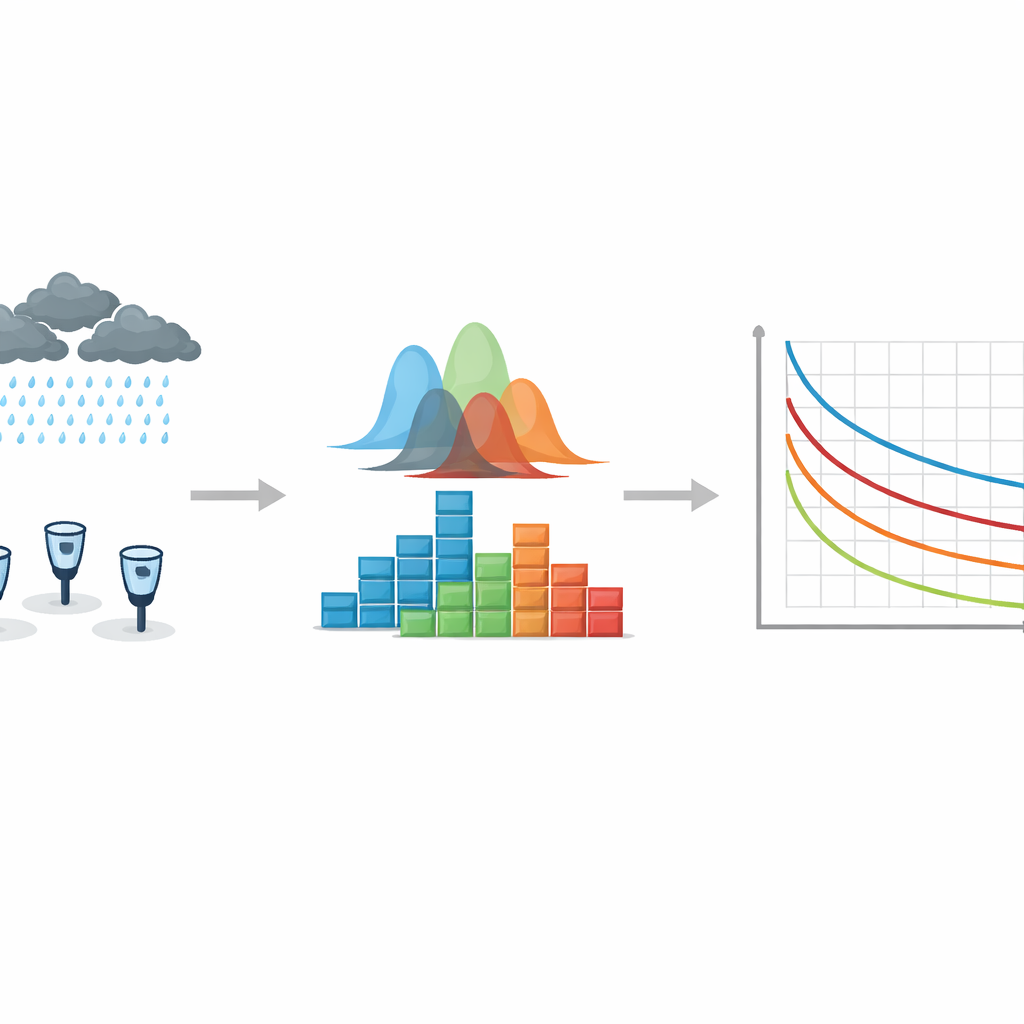
The authors build on the Global Sub‑Daily Rainfall (GSDR) dataset, the largest collection of hourly rain gauge records assembled so far, spanning more than 24,000 stations across all major climate regions. Unlike satellites and weather radars, which view rainfall over broad areas and can miss the most intense local bursts, gauges measure rain directly at a point on the ground. However, these records differ in quality, length, and completeness. To make them usable worldwide, the team applied a strict quality‑control system that flags suspicious values, checks consistency with nearby stations and longer‑term records, and screens out data with too many gaps. Only stations with enough reliable years of data were kept for detailed analysis.
Turning rare storms into useful design numbers
Engineers often work with “return periods” – for example, the typical intensity of rain expected once every 10, 30, or 100 years for a given storm duration. The relationship between storm intensity, how long it lasts, and how often it occurs is captured by intensity‑duration‑frequency (IDF) curves. To create these curves, the authors first extracted, for each station, the largest rainfall event in every year for four key durations: 1, 3, 6, and 24 hours. They then used established methods for analyzing extremes to estimate how likely very large but rare events are at each location, turning noisy records of past storms into smooth curves that describe the local risk of intense downpours.
Combining local detail with regional patterns
Because many stations have relatively short records, relying only on a single gauge can make estimates of very rare storms uncertain. The study therefore uses two complementary approaches. In single‑gauge analysis, each station is treated on its own, preserving its unique behavior where long records exist. In regional frequency analysis, nearby stations with similar rainfall characteristics are grouped and analyzed together, effectively pooling information to stabilize estimates. The authors developed an automated way to define these regions across the globe, checking that grouped gauges behave similarly and that the chosen statistical models fit well. The final dataset includes results from both approaches wherever possible, allowing users to compare and choose the method that best suits their risk tolerance.
What the new maps can – and cannot – tell us
With nearly 24,000 stations processed, the GSDR‑IDF dataset delivers almost 24,000 fitted IDF curves for 10‑, 30‑, and 100‑year events at sub‑daily time scales. The authors carefully examine how well the curves agree between neighboring stations and how estimates change with distance, concluding that they are most representative within roughly 100 kilometers of a gauge and become less reliable beyond 200 kilometers. They also compare their gauge‑based estimates to values derived from global weather reanalysis data, showing that previous gridded products tend to miss the most intense short‑duration storms, especially in the tropics. At the same time, the authors stress that the dataset represents mainly historical conditions up to about 2019 and does not directly account for ongoing climate change or long‑term shifts in rainfall patterns.
How this helps communities prepare
The GSDR‑IDF dataset provides, for the first time, a consistent, openly accessible set of short‑duration rainfall design curves based directly on ground observations worldwide. City planners, engineers, insurers, and researchers can now download station‑level files and figures, explore regional patterns of extreme rain, and integrate these curves into flood‑risk models and infrastructure design standards. While users must still consider local conditions, data gaps, and the possibility that future storms may be more intense than the past, this work marks a major step forward: it turns scattered records of fierce downpours into a coherent global resource for building more resilient cities and infrastructure.
Citation: Green, A.C., Guerreiro, S.B. & Fowler, H.J. Global Intensity-Duration-Frequency curves based on observed sub-daily rainfall (GSDR-IDF). Sci Data 13, 455 (2026). https://doi.org/10.1038/s41597-026-06858-4
Keywords: extreme rainfall, flash flooding, climate resilience, hydrological design, global rainfall dataset