Clear Sky Science · en
Lattice-Boltzmann for Porous Media: 100M+ GPU Hours
Why tiny rock spaces matter
When we store energy underground, capture carbon dioxide, or run fuel cells, the way two different fluids weave through tiny spaces in rock can make or break the technology. Yet watching these fluids move inside real rocks is extremely slow and expensive. This paper presents an enormous open dataset of computer simulations that do the next best thing: they recreate how water and oil-like fluids push past each other in realistic rock samples, using more than 100 million hours of graphics-processor time. The result is a shared resource that any researcher can use to test ideas about underground flow without needing a particle accelerator or a supercomputer of their own.
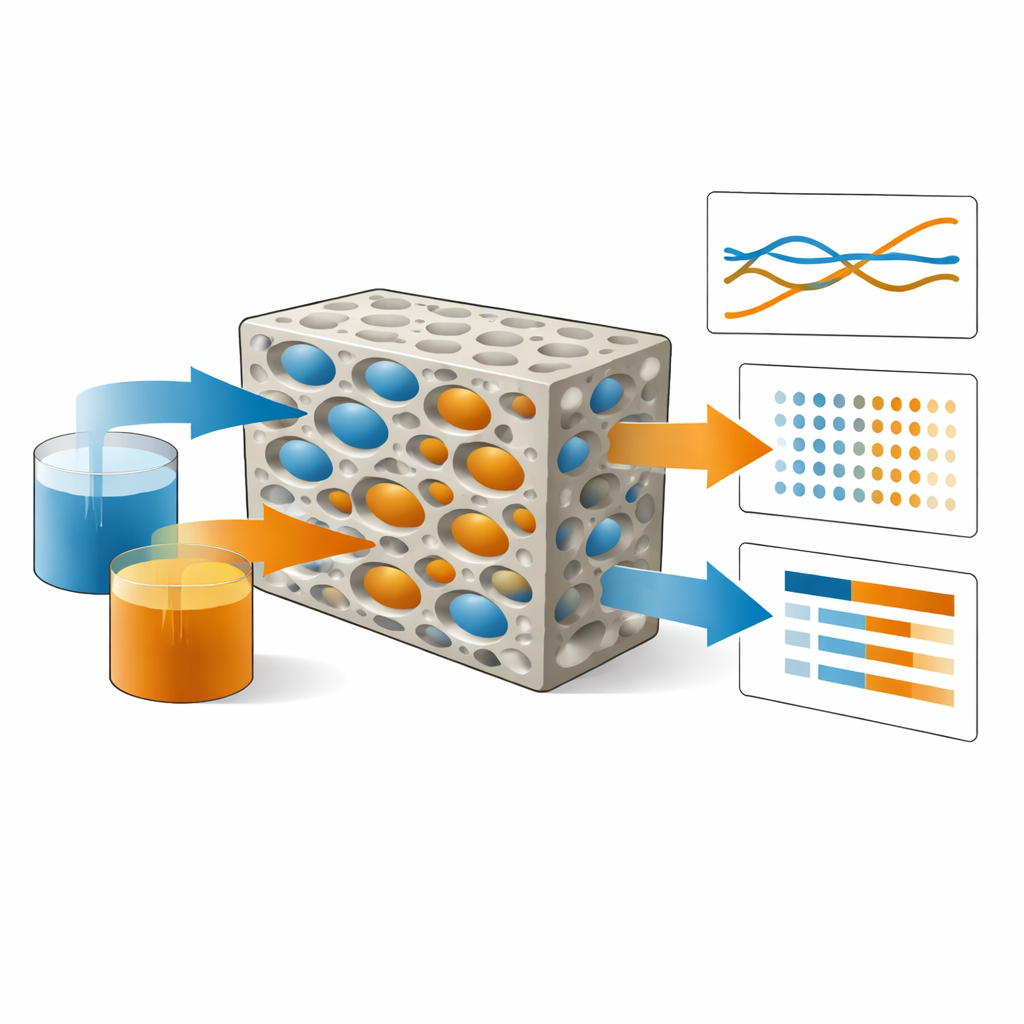
Exploring fluid motion in digital rocks
The authors focus on “two-phase flow,” where two fluids that do not mix, such as water and oil, move together through a maze of pores in rock. A key quantity for engineers is relative permeability, which tells you how easily each fluid moves when the other is present. Normally, full measurements demand weeks of careful lab work for each rock sample and set of conditions. Instead, the team used a specialized simulation package, LBPM, to calculate flow directly on 3D images of real rocks. These digital rocks came from X-ray microtomography scans of sandstone and sintered glass, capturing realistic shapes and sizes of pores down to a few micrometers.
A massive virtual experiment
Running realistic simulations at this fine scale is still very costly. The team harnessed high-performance computers with thousands of GPUs to sweep through conditions that would be impractical in the laboratory. They varied how strongly the rock surface prefers one fluid over the other (its wetting behavior), and how forcefully the fluids are pushed through (captured by a parameter called capillary number). For four different porous materials, they performed both “steady-state” and “unsteady-state” flow protocols that mimic standard core-flooding experiments used in the oil and gas industry. Altogether, they produced 50 full relative-permeability curves and more than 25,000 distinct fluid configurations.
Seeing shapes, not just averages
Beyond average flow rates, the simulations track the detailed shapes and connections of the fluids over time—information that is almost impossible to obtain at scale from experiments. LBPM separates connected flow pathways from isolated blobs, sometimes called ganglia, and measures their volume, surface area, curvature, connectivity, pressure, and motion. These quantities are logged at each simulation step into simple text tables, so that users can reconstruct how trapped pockets form, snap off, reconnect, or slowly drain. By comparing different rock types and wetting patterns, the dataset reveals how subtle changes in surface preference can shift where fluid gets trapped and how easily it moves, helping explain trends seen in lab measurements.
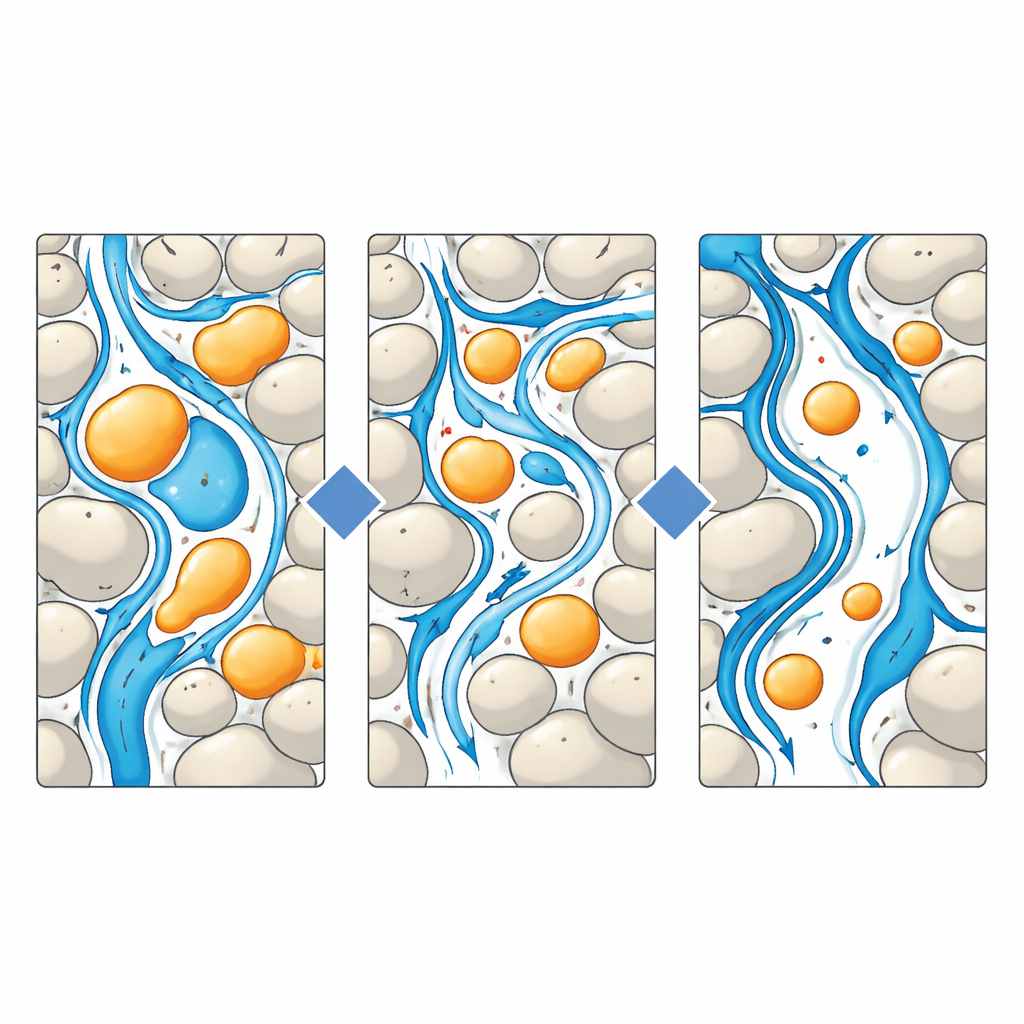
Lessons about wet rock and trapped fluid
Using the dataset, the authors validate that their simulations behave sensibly by checking known patterns. For example, as the rock becomes more oil-loving, the amount of oil left behind after a water flush tends to decrease, matching past experiments. In more water-loving cases with poorly resolved narrow throats, the simulations show early break-up of the non-wetting fluid and unusually flat flow curves, illustrating how image resolution can mislead results. In other rocks with better-resolved pores, the shift in flow curves with changing wetness lines up with earlier lab studies. Measures of connectivity confirm that under certain intermediate conditions both fluids remain highly interconnected, a state associated with complex interface shapes and long-lived trapped clusters.
A shared foundation for future work
In simple terms, this article delivers a detailed map of how two fluids can share the same tiny spaces inside rock, under a wide variety of conditions, all encoded in reusable data. The simulations are cross-checked against cutting-edge X-ray imaging experiments and organized so that others can easily compute new summary curves, train machine-learning models, or test new theories about how pore-scale details add up to large-scale flow. For anyone working on underground carbon storage, hydrogen storage, groundwater cleanup, or fuel-cell components, this open dataset offers a powerful shortcut: instead of starting from scratch, they can build directly on more than 100 million GPU hours of carefully curated digital experiments.
Citation: Armstrong, R.T., Tavakkoli, O., Da Wang, Y. et al. Lattice-Boltzmann for Porous Media: 100M+ GPU Hours. Sci Data 13, 697 (2026). https://doi.org/10.1038/s41597-026-06823-1
Keywords: porous media, two-phase flow, digital rock, lattice boltzmann, relative permeability