Clear Sky Science · en
Comprehensive compilation and quality assessment of street-level urban air temperature measurements across European networks
Why City Heat Matters to Everyday Life
Scorching summers, sleepless nights in overheated apartments, and rising health risks during heatwaves are becoming familiar across Europe. Yet the thermometers we usually hear about are often at airports or in open fields, not in the streets where people actually live, walk, and sleep. This article introduces a new European dataset called FAIRUrbTemp that finally focuses on the air temperature we experience at street level in cities, giving researchers, planners, and health experts a much clearer picture of how heat really plays out in urban neighborhoods.
Taking the City’s Temperature
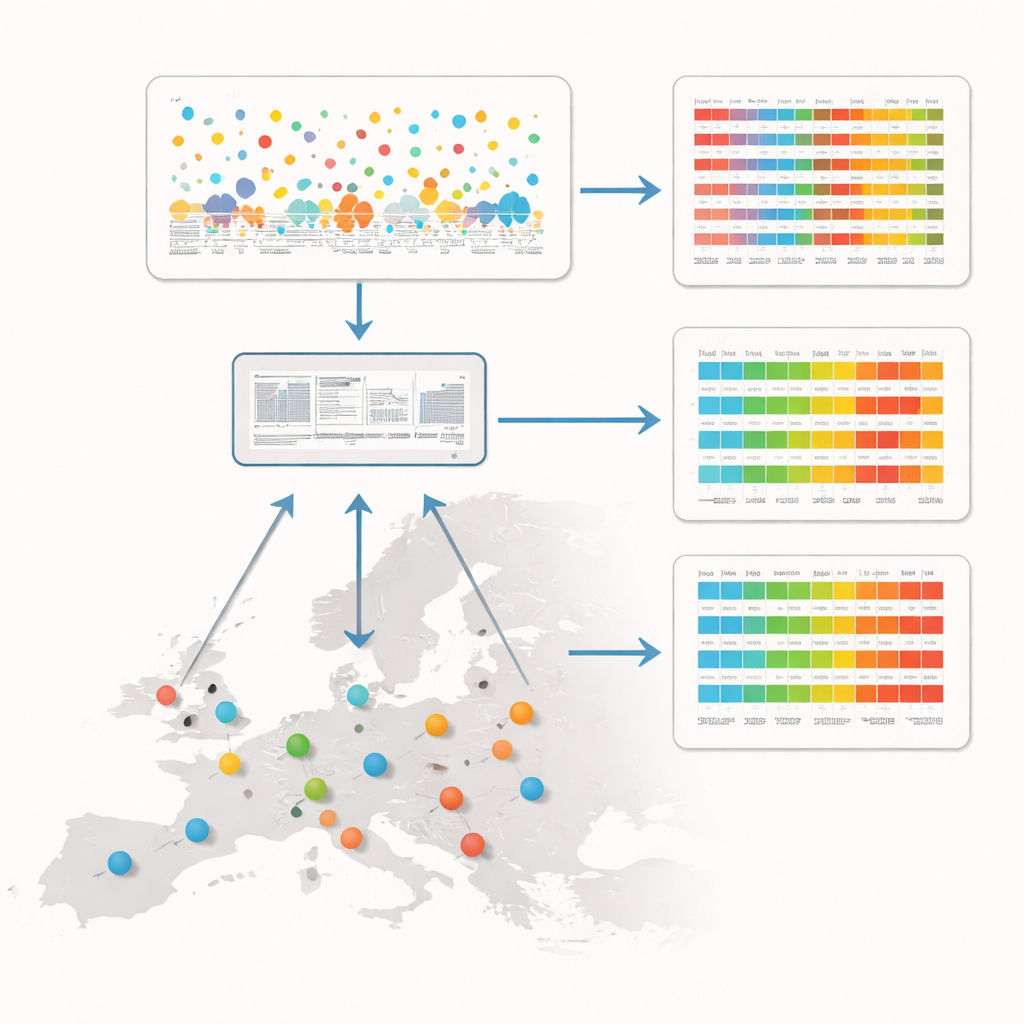
Instead of relying on a few traditional weather stations, FAIRUrbTemp combines measurements from 811 low-cost and commercial sensors spread across the streets of 12 European cities, from Amsterdam and Birmingham to Novi Sad and Zurich. These compact instruments sit just a few meters above the ground and record how hot the air actually gets where people live and work, often every few minutes. The result is a dense web of observations that can reveal not just the broad urban–rural contrast, but also how temperatures vary from one block to the next, showing where heat builds up and where it is naturally relieved by trees, parks, or water.
Bringing Many Different Systems Under One Roof
Because each city had built its own network in its own way—using different sensor models, installation heights, data formats, and time zones—the first challenge was simply making the information comparable. The team converted all records into a common standard format that bundles measurements with detailed descriptions of where, how, and with what they were taken. They also harmonized time stamps and geographic coordinates and organized the extra information, or metadata, at three levels: individual sensors, their measurements, and the wider networks. This standardization means that a researcher can now analyze data from, say, Basel and Turku together without having to unravel a tangle of local conventions first.
Separating Signal from Sensor Error
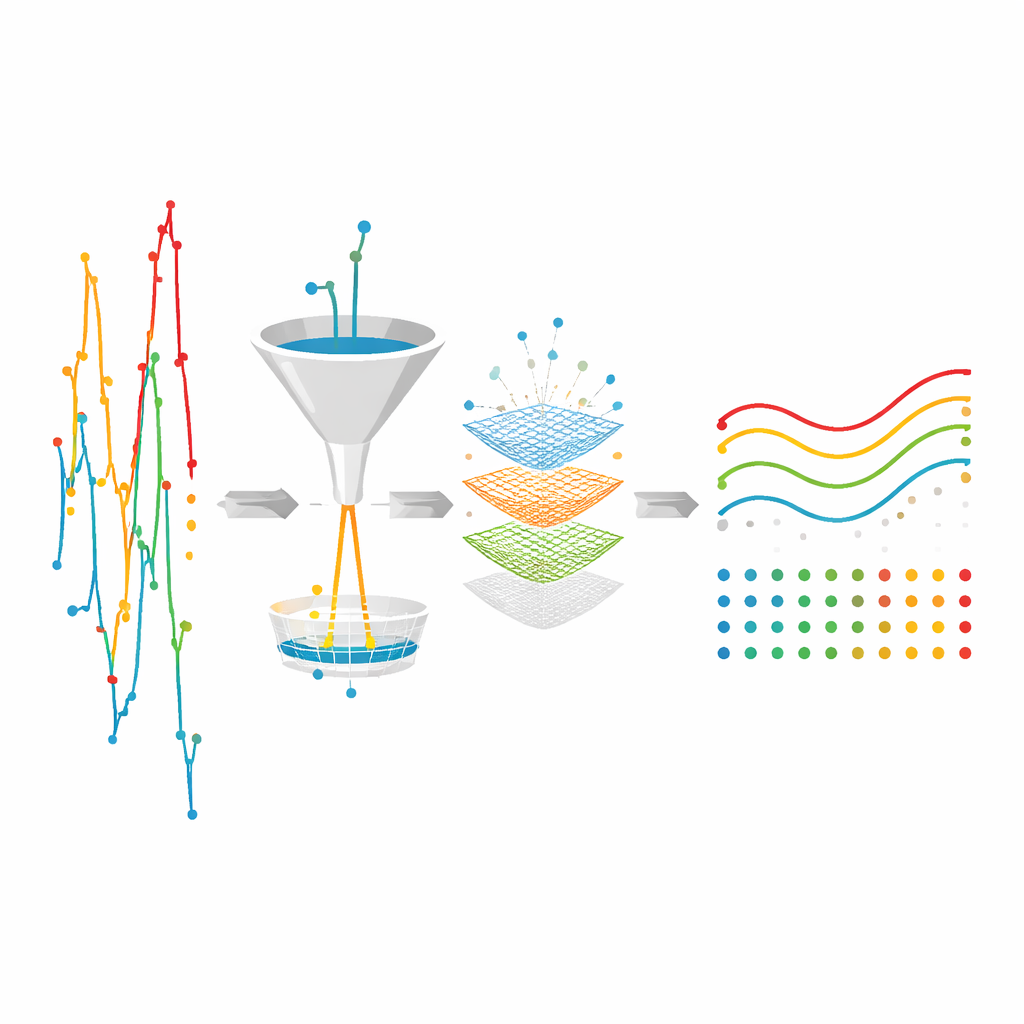
Dense city networks are powerful but messy: sensors can drift out of calibration, get hit by direct sun or reflections from cars and buildings, or simply malfunction. To tackle this, the authors designed a seven-step automated quality check that never deletes readings but flags those that may be unreliable. Some tests look for physically impossible or highly unlikely values, such as temperatures far outside regional extremes or jumps too sudden to be realistic. Others compare a sensor with its own recent past or with nearby sensors, asking whether a reading fits the pattern in space and time. Across the full dataset of roughly 136 million individual measurements, fewer than one percent were marked as suspicious, and most were obvious glitches.
What Affects Measurement Quality in the Real World
By examining how often and where data were flagged, the team could learn about the strengths and weaknesses of different instruments and locations. In Zurich, for example, two sensor types behaved differently: one tended to show more issues linked to sun exposure, while the other produced more odd values during calibration. Land cover also mattered. Stations surrounded by buildings and pavement showed more inconsistent readings than those in parks, forests, or over water. This does not mean urban data are “bad,” but that the temperature in built-up areas is more variable at very small scales, making it harder for a simple automatic check to distinguish between a genuine hot spot and a sensor problem.
From Data Resource to Cooler Cities
FAIRUrbTemp is released as open data, with raw, hourly, and daily temperature series plus full quality flags, so users can decide how strict they want to be when filtering. For urban climate researchers, it provides a rare, standardized view of street-level heat across many cities. For health experts, it offers a way to better link local temperature patterns to hospital admissions or mortality during heatwaves. And for planners, it gives evidence to support decisions on shade, greenery, and building design. In simple terms, this work does not yet cool cities directly, but it delivers the reliable, fine-grained temperature information that is essential for designing smarter, fairer, and more heat-resilient urban environments.
Citation: Amini, S., Huerta, A., Franke, J. et al. Comprehensive compilation and quality assessment of street-level urban air temperature measurements across European networks. Sci Data 13, 658 (2026). https://doi.org/10.1038/s41597-026-06804-4
Keywords: urban heat, street-level temperature, city climate data, heatwave risk, urban planning