Clear Sky Science · en
Atmospheric and oceanic data from a triangle-shaped moored array in the northern South China Sea during 2016
Watching Storms Shape the Sea
When a powerful typhoon sweeps over the ocean, it does far more than whip up big waves. Winds, pressure changes, and swirling currents reach hundreds or even thousands of meters below the surface, affecting climate, marine life, and coastal communities. Yet these hidden motions are hard to measure because they unfold far from land and across many depths. This study describes a rare and valuable dataset: months of continuous observations from an underwater “listening post” in the northern South China Sea, designed to track how the air and ocean talk to each other during a stormy year.
A Triangle of Floating Watchers
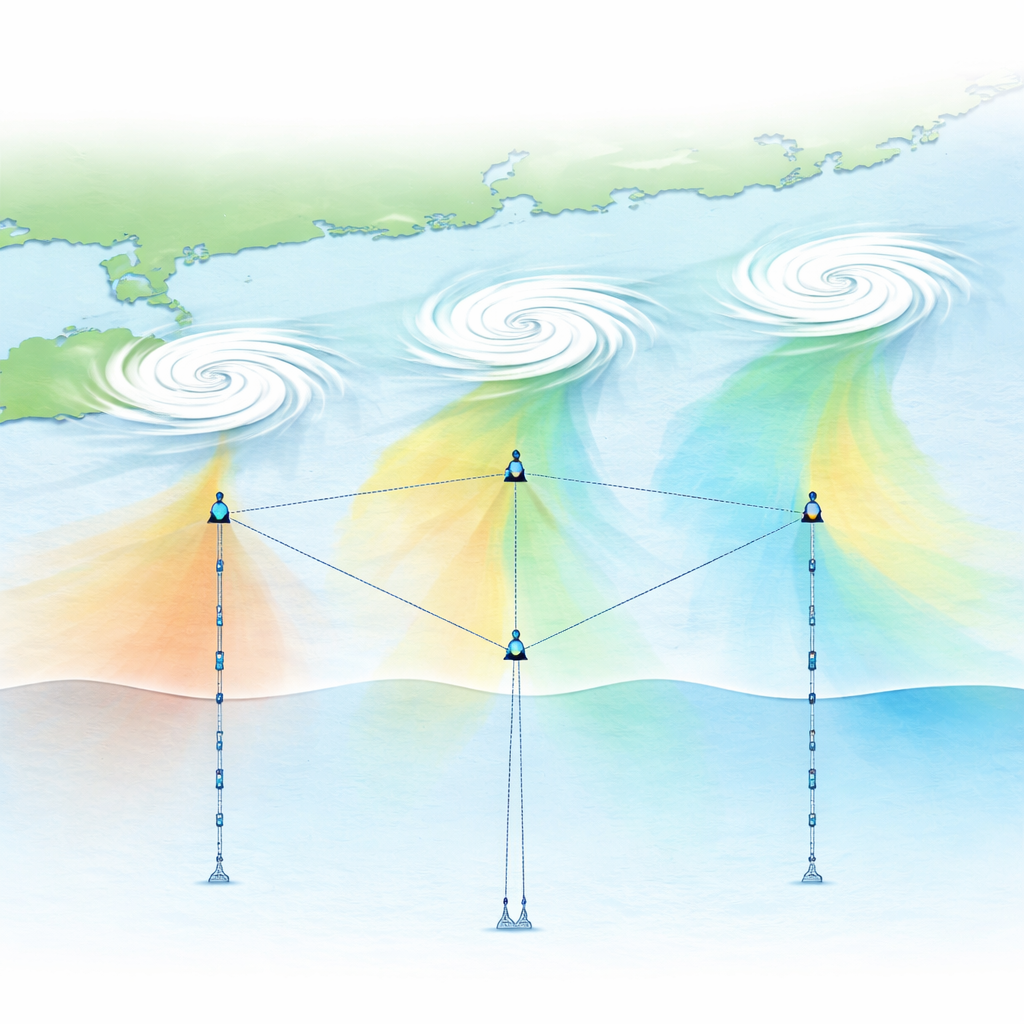
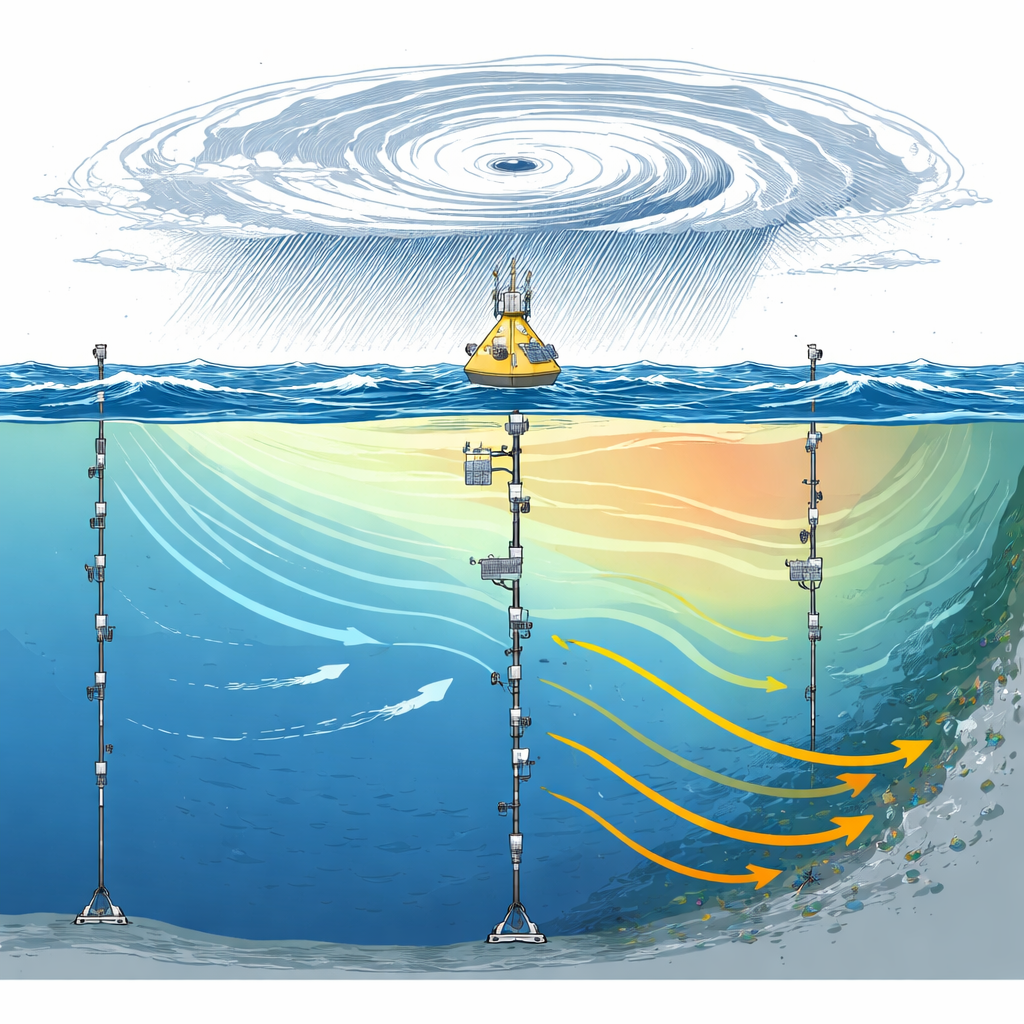
To capture this hidden drama, scientists deployed a triangle-shaped array made of three surface buoys and two deep moorings in the northern South China Sea during the summer and autumn of 2016. Each buoy carried weather instruments a few meters above the sea surface to record wind, air pressure, temperature, humidity, and rain. Long cables beneath the buoys and moorings held dozens of sensors that measured water temperature, saltiness, pressure, and currents from near the surface down toward the seafloor, at depths of up to about 3,000 meters. Together, this network watched the same patch of ocean continuously, day and night, over several months.
A Natural Laboratory for Ocean Storms
The South China Sea is a particularly energetic corner of the world ocean. It is deep, it hosts strong seasonal winds, and it lies in the path of many tropical cyclones. These features make it a natural laboratory for studying waves, eddies, tides, and deep flows that span from the surface to the abyss. During 2016, the observing array was crossed or influenced by several named storms, including Dianmu, Meranti, Aere, Sarika, and Haima. At the same time, the region was shifting from summer to autumn conditions, allowing the instruments to record how background currents and water layers change with the seasons as well as with passing storms.
What the Sensors Saw
The combined air and water measurements show that the instruments captured a wide range of ocean behavior. At the surface, winds were usually gentle, but during Tropical Cyclone Dianmu they jumped to around three to four times their normal strength, while air pressure dropped sharply and heavy rain fell. In the upper few hundred meters of the ocean, current meters recorded tidal motions, slow background flows, and special “near‑inertial” waves triggered by storm winds. These waves appeared several days after Dianmu passed, and even more clearly after later storms such as Sarika and Haima, then gradually spread downward from the surface into the ocean interior. Near the bottom, additional instruments showed that typhoons could jolt deep currents almost immediately, even though the water there stayed nearly constant in temperature and saltiness.
Layers of Warm and Cold Water
Temperature and salinity sensors along the cables revealed how storm winds rearranged the ocean’s layered structure. Near the surface, strong winds mixed warm water downward and sometimes pushed whole layers of water vertically, like a thick rug being heaved up and down. After Dianmu, for example, lines of constant temperature and saltiness were shoved downward below about 200 meters, a sign of storm‑driven downwelling. Over the season, the data also captured the normal deepening of cooler, saltier layers and the slight changes in near‑bottom properties, showing that while currents near the seafloor can respond quickly to storms, the deep water itself remains relatively stable.
A Lasting Resource for Climate and Weather Science
Rather than focusing on one specific discovery, this work provides a carefully documented dataset that other researchers can freely use. The records, stored in standard netCDF files, include detailed descriptions of each instrument, its depth, and its accuracy, but the data themselves are kept as originally measured. Scientists can now draw on these observations to study air‑sea heat exchange, test computer models of typhoon‑ocean interaction, refine estimates of surface fluxes, and explore how energy from storms and tides moves from the surface into the deep sea. In simple terms, this triangle of buoys and moorings turns a once‑invisible region of the storm‑tossed ocean into a shared window that helps us better understand how weather above and water below are tightly linked.
Citation: Zhang, H., Li, Q., Chen, D. et al. Atmospheric and oceanic data from a triangle-shaped moored array in the northern South China Sea during 2016. Sci Data 13, 467 (2026). https://doi.org/10.1038/s41597-026-06801-7
Keywords: South China Sea, tropical cyclones, air–sea interaction, ocean moorings, ocean currents