Clear Sky Science · en
Carbon footprint dataset of concrete based on field surveys at commercial mixing plants in Shandong, China
Why the climate cost of concrete matters
Concrete is everywhere: in our homes, roads, bridges, and skyscrapers. But making it releases vast amounts of planet-warming carbon dioxide. This study zooms in on one of China’s largest industrial provinces, Shandong, to answer a deceptively simple question with big implications: how much carbon does a cubic meter of real, everyday concrete actually emit, and what drives those emissions in practice rather than theory?
A closer look at a concrete powerhouse
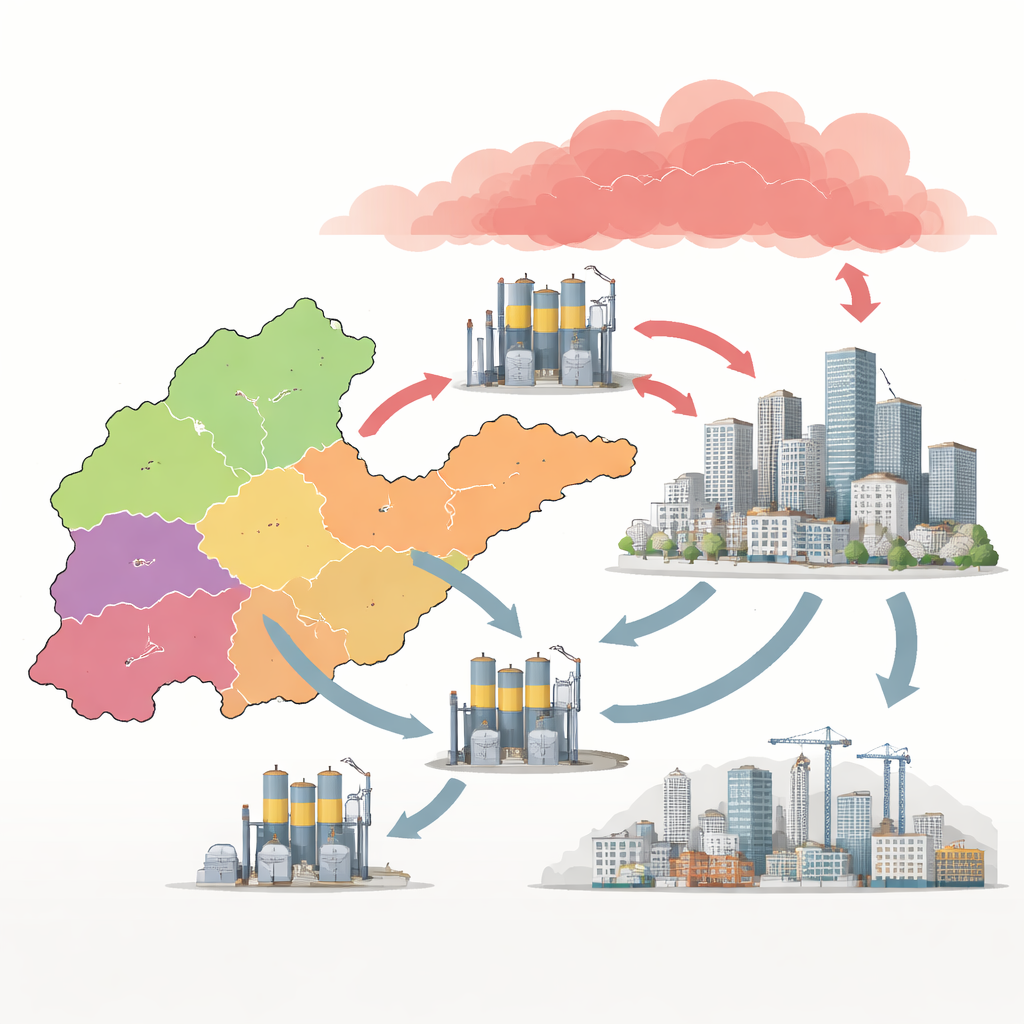
China produces more than half of the world’s concrete, and Shandong is one of its industrial engines. The province hosts major cement and concrete producers and a mix of coastal ports, inland cities, and heavy industry. To capture this diversity, the researchers divided Shandong into five subregions—east, west, south, north, and central—and conducted field surveys at commercial concrete mixing plants from 2020 to 2024. They collected 993 detailed mix designs covering common strength grades used in buildings and infrastructure. For each batch, they recorded how much cement, sand, gravel, water, mineral additives, and chemicals were used, how these materials were transported, and how much electricity the mixing equipment consumed.
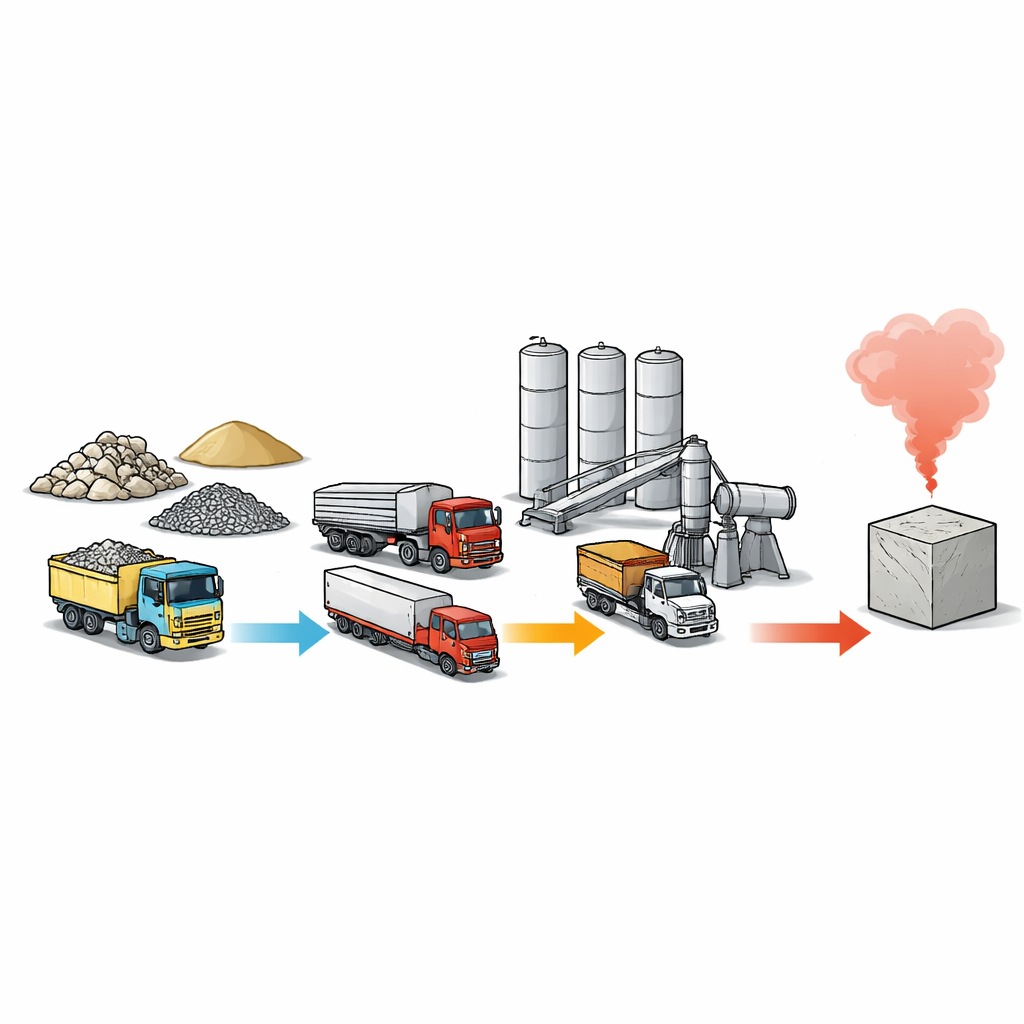
Following each step from raw materials to fresh concrete
The team traced emissions using a “cradle-to-gate” boundary, meaning they counted everything from the production of raw materials up to the point when fresh concrete leaves the plant, but not what happens on the construction site or during the building’s life. They split the carbon footprint into three stages: making materials like cement and aggregates, transporting them by truck or rail, and running mixers and other equipment using electricity. Using official Chinese and international guidelines, they assigned a carbon factor to each material, transport mode, and kilowatt-hour of electricity. This allowed them to calculate emissions per cubic meter for different concrete grades on a consistent basis.
Turning messy reality into a clear picture
Real-world production is variable, so the researchers examined how key inputs behave statistically. They found that the amounts of raw materials in the mixes cluster neatly around average values, while transport distances and electricity use are more skewed, with a small share of plants or suppliers responsible for unusually long trips or high energy use. To capture this uncertainty, they built a probabilistic model using 10,000 Monte Carlo simulations for each strength grade. In essence, the computer repeatedly “rolled the dice” within the observed ranges of material use, transport, and energy to produce a spread of possible carbon footprints rather than a single number. When they compared these simulated results to actual survey data, the match was extremely close, giving confidence that the model represents real practice.
Finding the main culprit in the carbon bill
One clear pattern emerged: as concrete gets stronger, its carbon footprint rises sharply, almost doubling between the lowest and highest grades studied. A sensitivity analysis that tested 22 different factors showed why. Cement—powdered clinker that binds the mix together—dominates emissions, contributing more than 90 percent of the total for typical mixes. How much cement is used in each cubic meter matters far more than the precise transport distance of sand or the electricity spent on mixing. While switching longer trips from road to rail and replacing old, power-hungry equipment would help, changes in cement content, cement type, and the use of alternative binders offer the largest leverage for cutting emissions.
Regional patterns and room for improvement
The dataset also reveals how local industry and geography shape climate impacts. Southern Shandong, a traditional building-materials hub with cement-intensive production and heavy reliance on trucks for aggregates, shows the highest emission intensity, roughly 15 percent above the lowest region. Across the province, average emissions from concrete have edged down by about 6 percent since 2021, helped by new “green building” policies and efficiency efforts, but there is still a large gap between typical practice and best available performance. Many plants consume significantly more electricity than advanced benchmarks, largely due to aging equipment, underscoring the potential gains from retrofits and better process control.
What this means for buildings and climate
For non-specialists, the core message is straightforward: most of the climate impact of concrete comes from cement, and from how much of it we choose to use. By optimizing mix designs to use less cement, blending in materials like fly ash or slag, favoring cleaner transport routes, and upgrading plant equipment, builders and policymakers can cut the carbon cost of essential infrastructure without sacrificing safety. The Shandong dataset, openly shared by the authors, provides a detailed, region-specific yardstick that can guide practical decisions and inform future standards as the world looks for ways to build more while emitting less.
Citation: Niu, D., Zhou, J. & Guo, B. Carbon footprint dataset of concrete based on field surveys at commercial mixing plants in Shandong, China. Sci Data 13, 465 (2026). https://doi.org/10.1038/s41597-026-06789-0
Keywords: concrete carbon footprint, cement emissions, green building materials, life cycle assessment, China construction industry