Clear Sky Science · en
Water Masses of the Arctic from 40 Years of Hydrographic Observations
Why the Arctic’s Hidden Layers Matter
The Arctic Ocean is warming and losing sea ice faster than almost anywhere else on Earth, with consequences for weather, wildlife, and global sea levels. Beneath the ice and waves, however, the Arctic is not a single uniform pool of water. It is built from distinct layers and streams, each carrying its own heat, salt, and nutrients. This paper explains how scientists have, for the first time, pulled together 40 years of measurements to map and classify these hidden "water masses" across the entire Arctic, and why that matters for understanding future climate change.
Different “Flavors” of Arctic Water
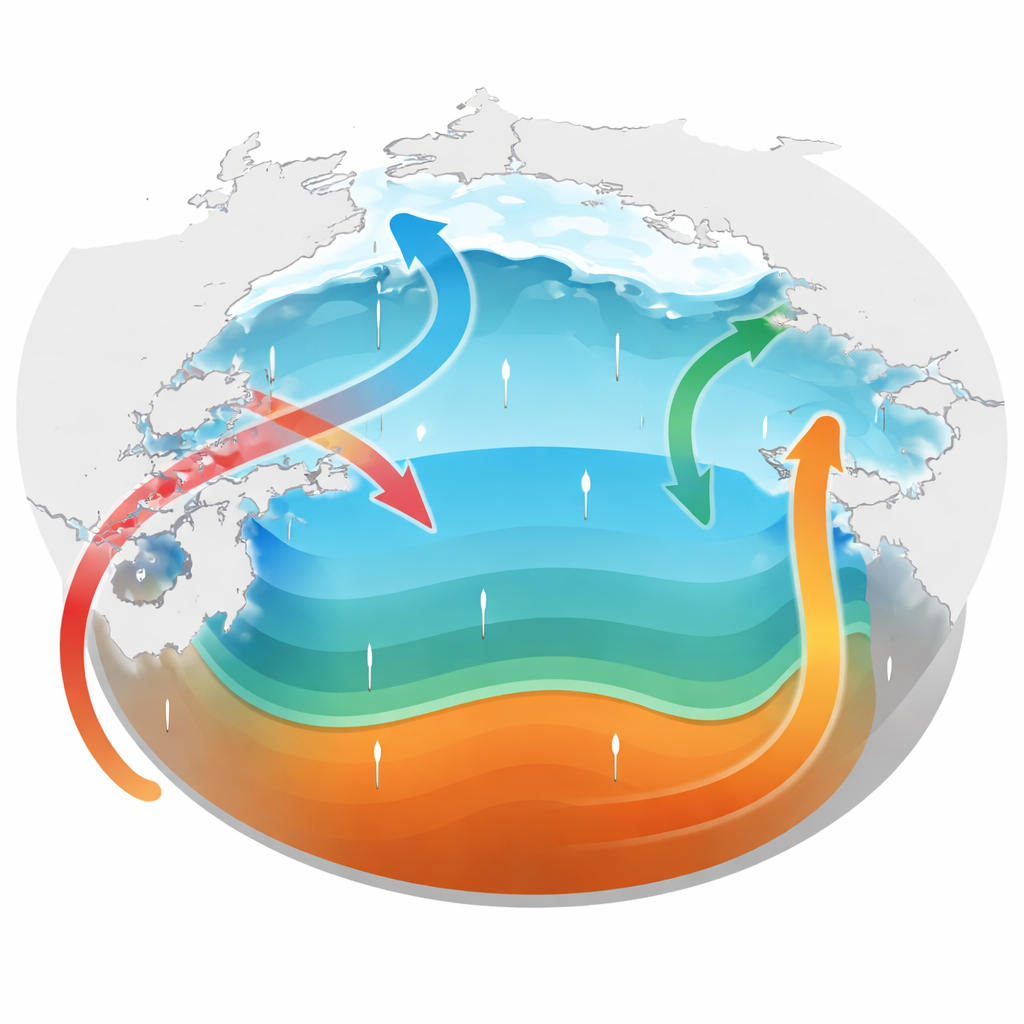
Just as the atmosphere is organized into air masses, the ocean is organized into water masses: large bodies of water that share a common origin and characteristic temperature, saltiness, and chemistry. In the Arctic, frigid, relatively fresh surface waters sit above saltier layers that flow in from the Atlantic and Pacific Oceans. Because the region is so cold, the density of seawater is controlled more by salt than by temperature, so the saltier Atlantic-derived water tends to plunge beneath the fresher surface layer as it enters through gateways like Fram Strait and the Barents Sea. Pacific water entering through the narrow Bering Strait also sinks below the surface in parts of the Canada Basin. Together, these layers control how heat and freshwater are stored and moved around the Arctic, influencing how fast sea ice melts and how the Arctic, in turn, affects the global climate system.
Forty Years of Watching a Remote Ocean
Measuring the Arctic Ocean is notoriously difficult because of sea ice, harsh weather, and darkness in winter. Rather than relying on a single observing system, the authors compiled existing high-quality data from a range of sources: ship-based surveys, moored and drifting instruments tethered to the ice, and autonomous profilers loosely akin to underwater weather balloons. They focused on the upper 1,000 meters of the water column and three key properties: temperature, salinity, and dissolved oxygen. After carefully removing duplicates and obvious outliers and averaging profiles into 10-meter depth bins, they produced a consistent, basin-wide archive spanning from the early 1980s to 2024. Although some regions and seasons remain under-sampled, this combined record provides the best long-term picture so far of how the Arctic’s interior has evolved.
Teaching a Computer to Recognize Water Layers
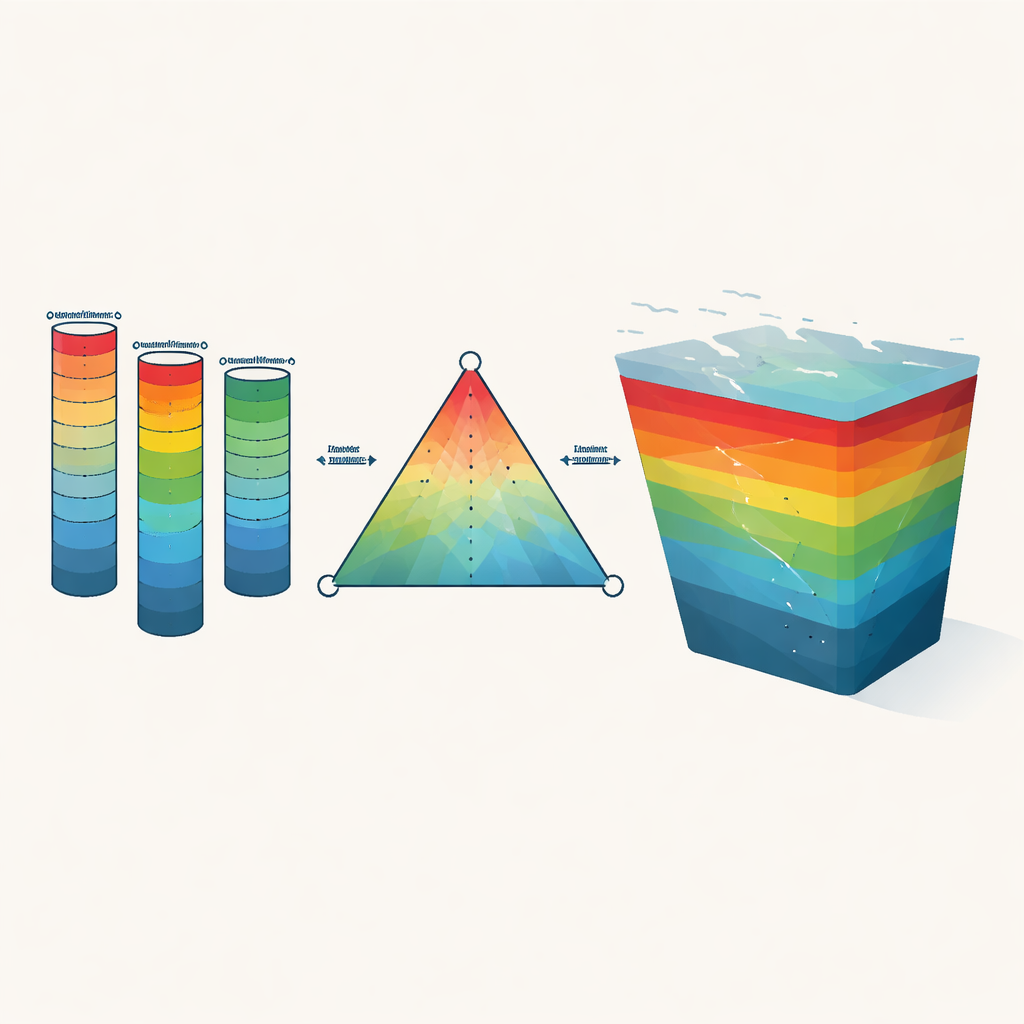
Traditionally, oceanographers identify water masses by solving a set of equations that treat each observation as a mixture of a few “pure” source types—for example, a characteristic Arctic surface layer, several flavors of Pacific water, and several flavors of Atlantic water. This approach, known as multiparameter mixing analysis, requires both detailed knowledge of the end members and measurements of oxygen as well as temperature and salinity. Oxygen, however, is available for only about one in ten profiles in the Arctic. To overcome this limitation, the authors first applied the classical method wherever oxygen was measured, then used those results as a training set for a machine-learning model based on random forests. By feeding the model temperature, salinity, location, depth, and time of year, they taught it to predict the fraction of each water mass even when oxygen was missing, increasing usable coverage by roughly an order of magnitude.
What the New Maps Reveal
The resulting Water Masses of the Arctic (WMA) dataset traces how Atlantic and Pacific waters spread through the Arctic and how their influence has changed over decades. The maps reproduce known features such as warm Atlantic layers deepening from the gateway seas into the interior basins and Pacific-origin waters feeding the Beaufort Gyre in the western Arctic. They also capture broad trends often referred to as “Atlantification” and “Pacification”—the growing reach of Atlantic and Pacific waters into regions that were once more strongly dominated by cold, locally formed layers. In the gateway seas, the fraction of Atlantic water has risen in line with independent evidence of increasing heat inflow, while in the Beaufort Gyre, the fraction and properties of Pacific water show changes consistent with a warmer, more voluminous inflow through Bering Strait. The authors stress that some surface features are less certain, both because surface waters are strongly modified by weather and ice formation and because data coverage is patchy.
A New Benchmark for Future Arctic Change
To check the reliability of their classification, the team tested how sensitive the results are to choices about the source types, to changes in their properties over time, and to the weighting of oxygen versus temperature and salinity. They also compared their expert-guided scheme with an independent, unsupervised clustering method that simply groups data points with similar properties. Across these tests, the main water masses and their pathways proved robust, and the machine-learning model reproduced the traditional calculations with high accuracy, even when whole regions or years were withheld during training. The final WMA product, openly released along with reproducible code, now offers scientists and modelers a common, observation-based framework for tracking how the Arctic’s layered structure evolves, evaluating how well climate models represent it, and, ultimately, improving predictions of how a warming Arctic will reshape conditions far beyond the polar circle.
Citation: Oglethorpe, K., Lanham, J., Reiss, R.S. et al. Water Masses of the Arctic from 40 Years of Hydrographic Observations. Sci Data 13, 456 (2026). https://doi.org/10.1038/s41597-026-06749-8
Keywords: Arctic Ocean, water masses, Atlantic inflow, Pacific inflow, machine learning