Clear Sky Science · en
Coincident maps of changing land cover, land use, and forest condition in the United States, 1985-present
Why Watching the Landscape Matters
Across the United States, forests burn and regrow, cities expand, farms shift crops, and lakes swell or shrink. Yet from above, many of these very different stories can look surprisingly similar: a patch of trees is a patch of trees, whether it is a managed timber stand, a city park, or a wilderness forest. This paper introduces the Landscape Change Monitoring System (LCMS), a nationwide mapping effort that teases apart not just what is on the ground (land cover), but how people use it (land use) and how vegetation itself is changing over time. For anyone concerned about climate, wildlife, water, or urban growth, LCMS offers a powerful new way to see how America’s landscapes have evolved from 1985 to the present.
Seeing More Than Just Green and Gray
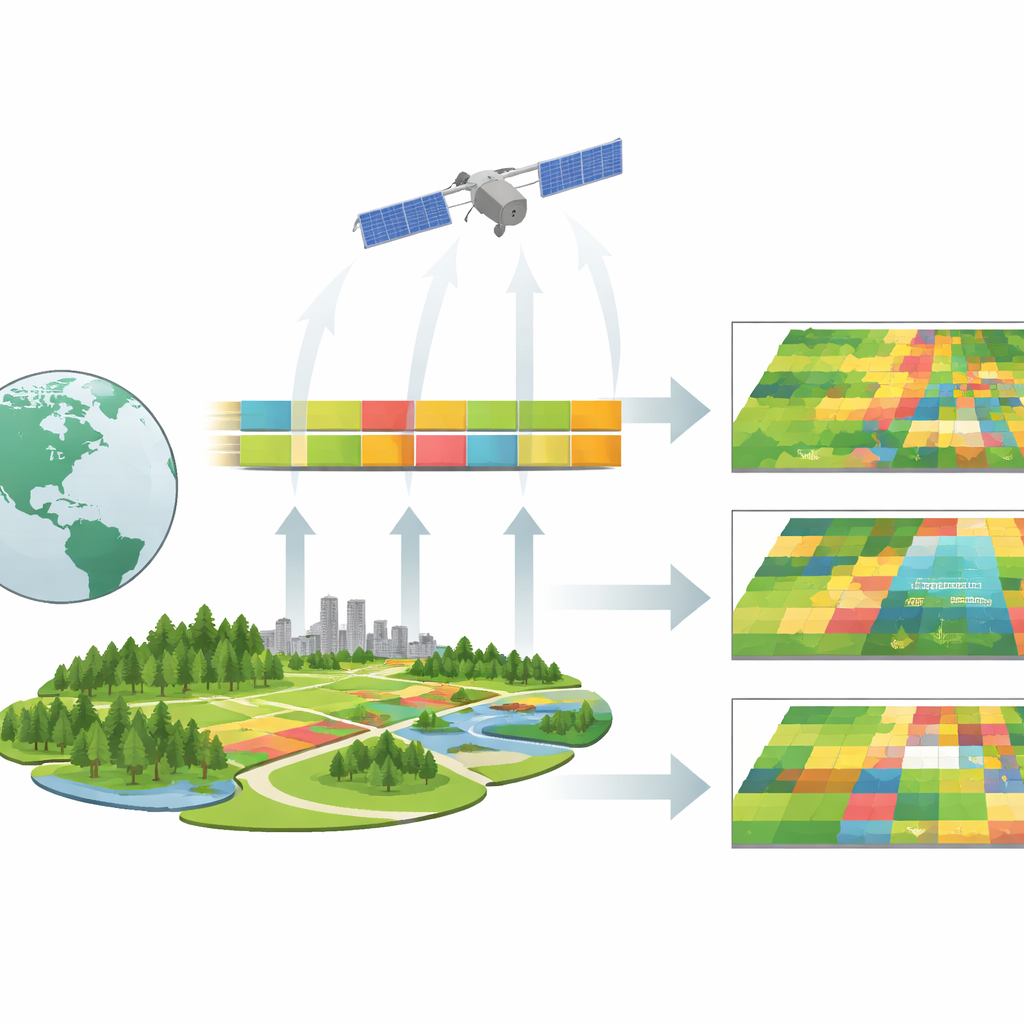
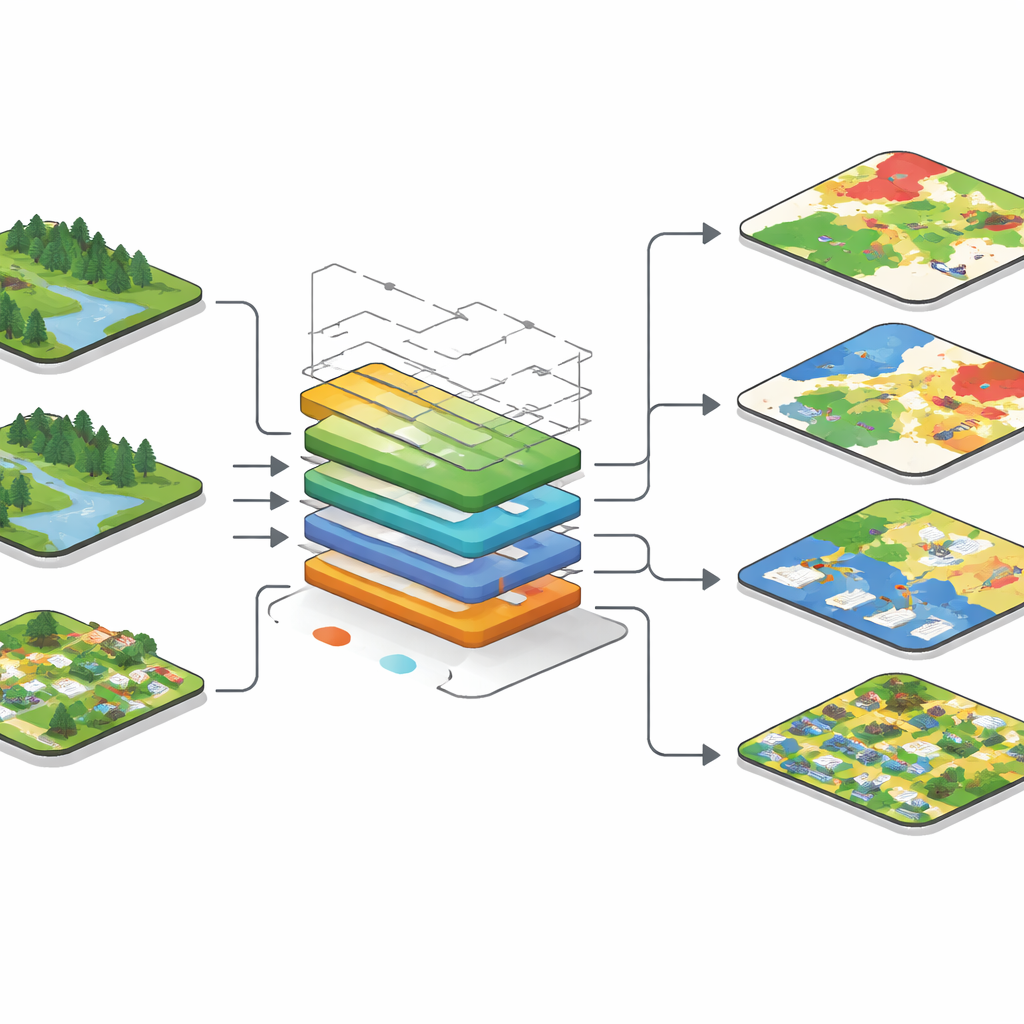
Traditional satellite maps usually describe land using broad visual categories—forest, cropland, water, pavement. LCMS starts from a simple but important distinction: the green canopy we see (land cover) is not the same as the purpose we assign to a place (land use). A forest that is temporarily thinned by harvest but allowed to regrow has a very different long-term impact than a forest cleared forever for housing or a highway, even though both may initially appear as tree loss from space. LCMS therefore produces three coordinated map products at 30‑meter resolution for nearly all U.S. lands: annual land cover, annual land use, and a separate record of vegetation disturbance and regrowth. This three-part view lets users tell whether a given change is a fleeting scar on a working forest, a shift from rangeland to new woodland, or a lasting conversion of farmland to suburbs.
Turning Decades of Images into Consistent Stories
To build these maps, the authors draw on a vast archive of satellite images from the Landsat program, joined more recently by Europe’s Sentinel‑2 satellites. Instead of looking at each year in isolation, LCMS fits mathematical curves through the full time series of images for every pixel, using two complementary algorithms known as LandTrendr and CCDC. One is tuned to spot sudden breaks in long‑term trends, such as a fire or clear‑cut; the other focuses on patterns within each growing season, such as the distinct seasonal rhythm of croplands or grasslands. By combining both, LCMS can better distinguish real, lasting change from short‑lived noise like clouds, snow, or year‑to‑year weather swings. Terrain information such as elevation and slope is also folded in, helping to separate, for example, high‑country rock from lowland pavement.
Ground Truth from Thousands of Sample Points
Even the best algorithms need trustworthy examples to learn from. LCMS relies on more than 13,000 carefully interpreted reference locations across the contiguous U.S., southeastern Alaska, Hawaii, Puerto Rico, and the U.S. Virgin Islands. Using a tool called TimeSync, analysts scroll through decades of satellite images and high‑resolution aerial photos at each point, assigning, year by year, what the land cover is, how it is used, and what kind of change—fire, harvest, storm damage, or slow decline—it has undergone. Because some important situations, like forest loss or impervious urban surfaces, are relatively rare, the team deliberately oversamples these categories to ensure the models learn them well. Random forest machine‑learning models are then trained separately for change, land cover, and land use, and their performance is tested with rigorous cross‑validation techniques that account for the sampling design.
What the New Maps Reveal
With annual maps from 1985 onward, LCMS can trace the histories of well‑known environmental stories. Around Utah’s Great Salt Lake, it captures the dramatic retreat of shorelines during recent drought years, showing water cover shrinking to barren flats while land use remains categorized as “other,” reflecting that new grazing or development lags behind exposed lakebed. Along Florida’s Gulf Coast, LCMS highlights the swath of forest knocked down by Hurricane Michael in 2018 as a burst of rapid vegetation loss followed by gradual regrowth, while underlying land use stays largely forest. In Colorado’s Front Range, it separates slow tree decline from bark beetles from the abrupt scars of major wildfires, and shows where vegetation is beginning to recover. Across these examples, a recurring pattern appears: land cover can flip rapidly between trees, shrubs, and grasses after disturbance, but land use may hold steady for years.
From Maps to Better Decisions
For forest managers and policymakers, the most practical payoff of LCMS is sharper estimates of how much land is actually managed as forest, not just where trees happen to be. When the authors combine LCMS land use maps with the U.S. Forest Service’s long‑running network of field plots, they find that statistical estimates of forest area become roughly three times more precise than using plots alone at regional scales. That means agencies can track trends and evaluate policies with fewer field visits and greater confidence. More broadly, LCMS provides open, annually updated data and online tools that let users animate change, summarize conditions by county or forest, and design their own analyses. By clearly separating what the land looks like, how people use it, and how vegetation is responding, this system offers a clearer window onto the changing American landscape—and a stronger foundation for keeping it healthy.
Citation: Housman, I.W., Healey, S.P., Heyer, J. et al. Coincident maps of changing land cover, land use, and forest condition in the United States, 1985-present. Sci Data 13, 575 (2026). https://doi.org/10.1038/s41597-026-06743-0
Keywords: land cover change, land use mapping, remote sensing, forest monitoring, satellite time series