Clear Sky Science · en
Global crop suitability datasets for 17 crops under present (2024) and future climate scenarios (2041–2100)
Why the future of crops concerns everyone
As the world population grows and the climate warms, a basic question becomes urgent: where on Earth will we still be able to grow our staple crops? This study tackles that question by building detailed global maps that show how suitable different places are for growing 17 major crops today and under future climate conditions. These maps can help farmers, planners, and citizens understand how food production might shift over the coming decades.
Mapping where crops can thrive
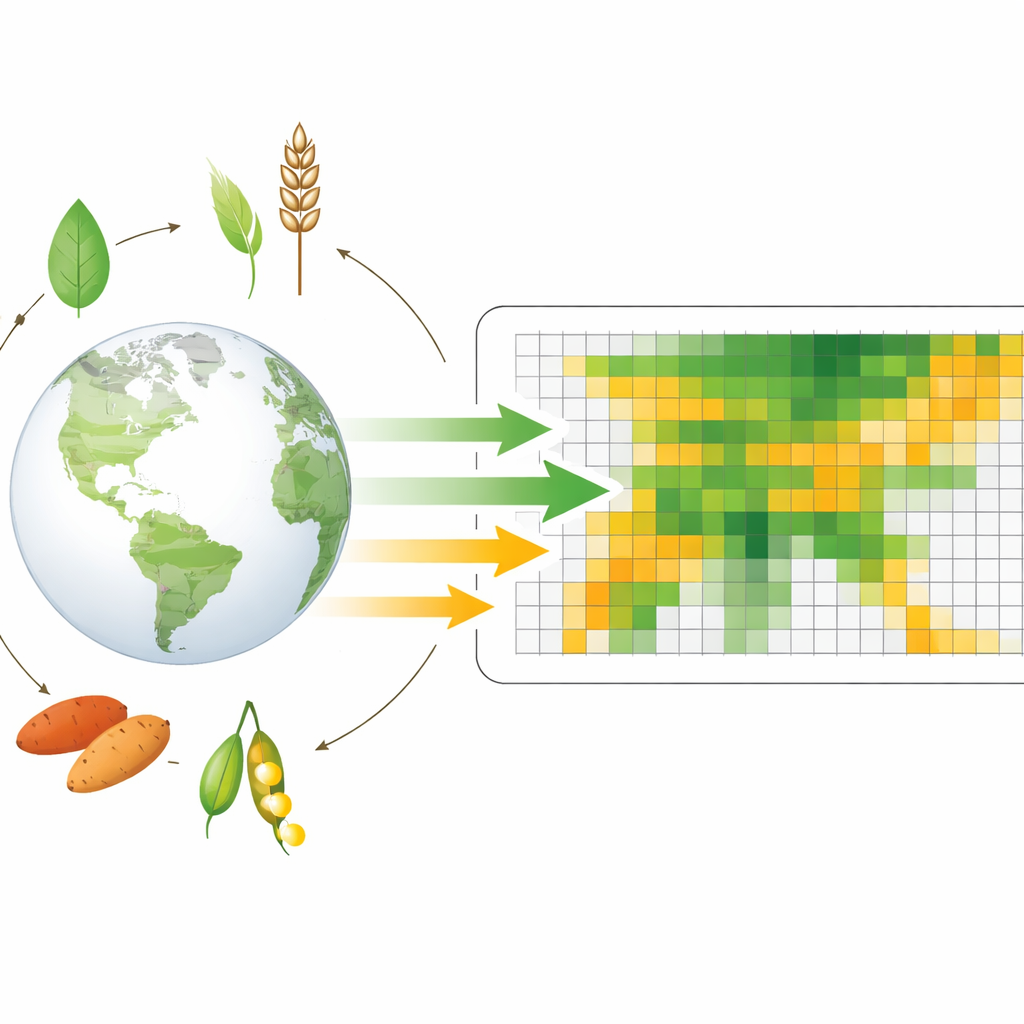
The authors focus on “crop suitability,” meaning how well local climate and natural conditions can support a crop’s full growing cycle, from planting to harvest. Instead of relying on older rule-of-thumb approaches or coarse global averages, they assemble a very large, up-to-date dataset that reflects how modern crop varieties are actually grown today. They combine three main sources of crop presence data: field observations from a biodiversity database, detailed crop maps from satellites, and a recent global crop statistics dataset. Together, these sources produce millions of presence points for 17 important crops, including wheat, rice, maize, soybeans, root crops, oil crops, and industrial crops such as cotton and sugarcane.
Turning Earth data into a crop suitability atlas
To understand why crops appear where they do, the study pairs these crop locations with 30 environmental factors that strongly influence plant growth. These factors cover three main aspects of the landscape. Topographic data describe the height and shape of the land, including elevation and slope. Soil data characterize texture, depth, salt content, organic matter, and nutrients. Meteorological data capture rainfall, temperature, radiation, soil moisture, and heat sums needed for crops to develop. For the current period (2024), these variables come from high-resolution global products based on weather records, hydrology estimates, and satellite observations. For the future (2041–2100), the authors use climate projections from the latest generation of global climate models under four different socioeconomic and emissions pathways.
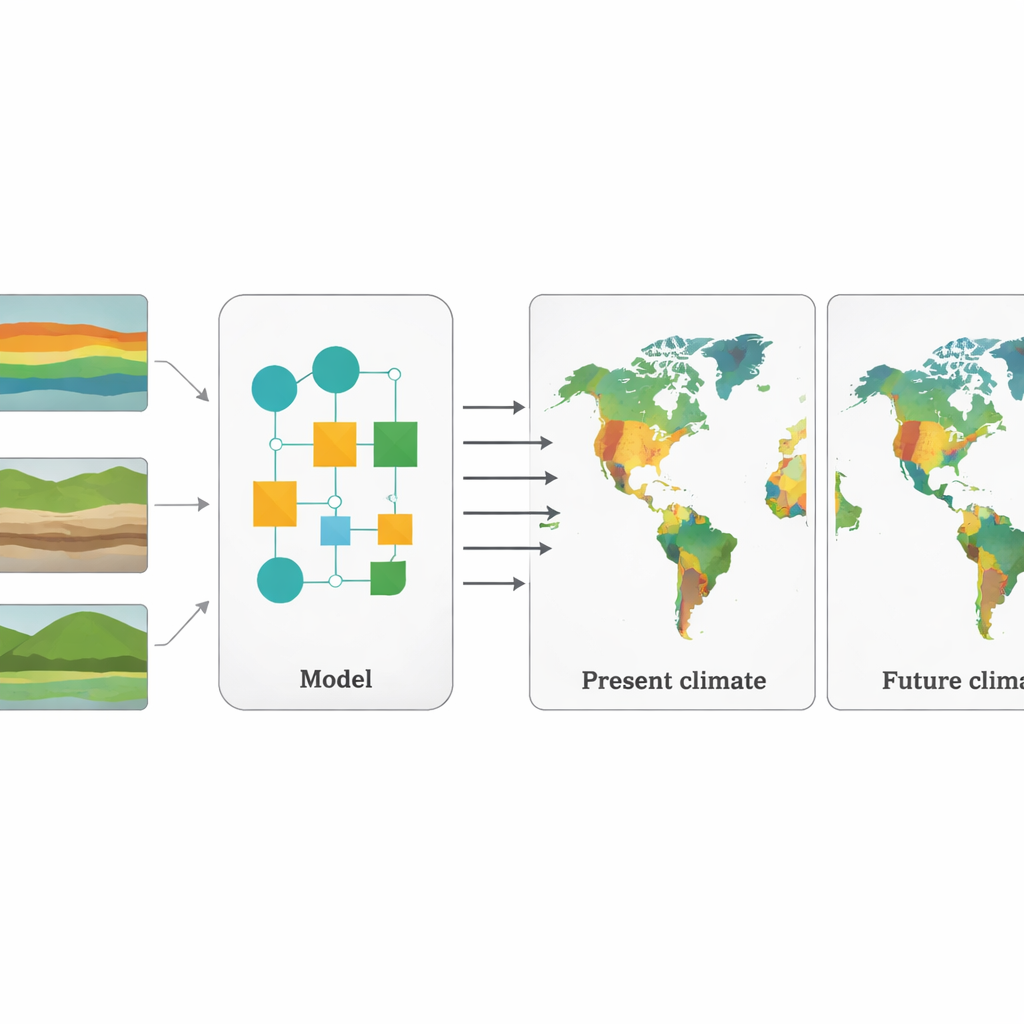
How the models learn from the land
With this combined dataset in hand, the team trains a separate machine-learning model for each crop using the random forest algorithm. For every sample point, the model sees whether the crop is present or absent and the associated environmental conditions. It then learns to distinguish places that favor the crop from those that do not. To avoid overfitting and to ensure the models transfer well across regions, the authors use a spatial cross-validation scheme that keeps training and testing data geographically separated. They also use a feature selection procedure to trim away redundant predictors and a Bayesian search to tune model settings. The resulting models achieve high accuracy: on independent test data, the average overall accuracy across 17 crops is about 94%, with both “suitable” and “not suitable” categories classified reliably.
Seeing today’s fields and tomorrow’s shifts
Once trained, the models are applied to every 1 km by 1 km grid cell across the world, for today’s climate and for three future time windows under four climate scenarios. Instead of a simple yes-or-no answer, the models output a continuous suitability score between 0 and 1, which can later be grouped into categories for visualization. The authors compare their present-day maps with widely used global suitability datasets such as GAEZ and GLUES. Their maps agree well at broad scales but show finer spatial detail and better alignment with independent, high-resolution crop maps in regions like Northeast China and Argentina. Temperature-related variables and heat sums emerge as especially important in explaining where crops can grow, highlighting the sensitivity of global agriculture to climate warming.
What this means for food and planning
The study delivers a freely available, high-resolution global atlas of crop suitability for 17 major crops, covering both the present and a range of future climate pathways. While the authors emphasize that future projections should not be read as exact forecasts—especially in regions where climates move beyond anything observed today—the maps provide a powerful tool for exploring relative gains and losses in crop potential. For decision-makers worried about feeding a larger population on a changing planet, these datasets can inform where to protect prime farmland, where new opportunities might appear, and where today’s cropping systems may need to adapt or shift.
Citation: Wang, T., Dong, J. Global crop suitability datasets for 17 crops under present (2024) and future climate scenarios (2041–2100). Sci Data 13, 691 (2026). https://doi.org/10.1038/s41597-026-06688-4
Keywords: crop suitability, climate change, food security, remote sensing, machine learning