Clear Sky Science · en
Path Loss Dataset from Field Measurements at 3.5 GHz for the Fifth Generation of Wireless Communications in Indoor Environments
Why Your Phone Signal Fades Indoors
Whenever you lose bars on your phone in a hallway, classroom, or library, you are running into a quiet but crucial problem: radio signals weaken as they travel. This weakening, called signal loss, determines how fast and reliable your wireless connection can be. As our homes, offices, and campuses fill with 5G devices and connected gadgets, engineers need hard numbers on how walls, doors, and room layouts affect signal strength. This paper offers exactly that: carefully measured data that show how a 5G‑relevant signal behaves inside real buildings.
Measuring Signal Strength in Real Buildings
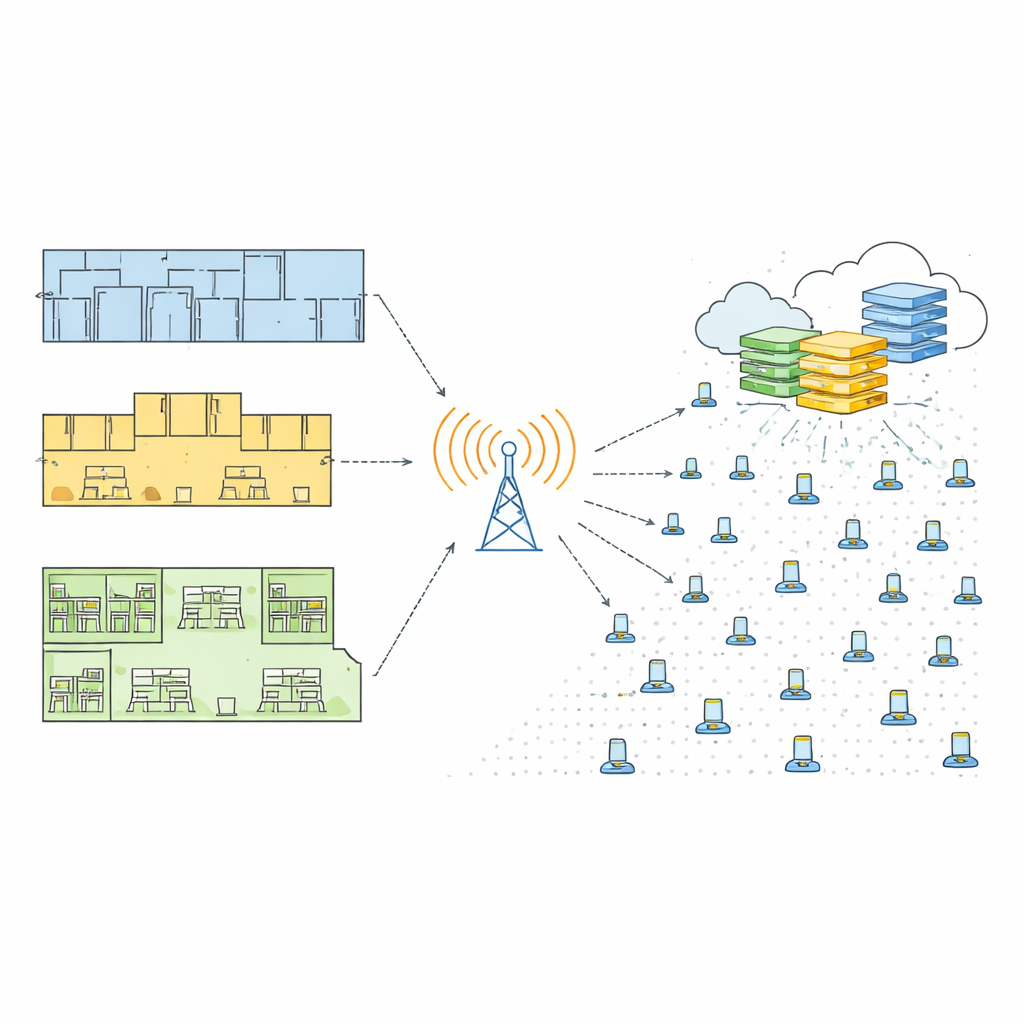
The authors focused on a frequency of 3.5 gigahertz, one of the main “sweet spots” for 5G networks indoors because it balances speed and coverage. Instead of working only with computer simulations or small experiments, they carried out large measurement campaigns in three everyday indoor settings at a research center in Mexico City: a long corridor filled with offices and labs, a compact student building with study rooms, and a modern library floor packed with bookshelves and study areas. All three places include familiar obstacles such as brick walls, glass panels, drywall partitions, wooden doors, metal columns and even an elevator shaft.
In each building, the team placed a transmitter that continuously sent out a 3.5 GHz signal at a fixed power level. They then walked a receiver through a carefully designed grid of points on the floor, spaced roughly one meter apart. At every point, they used precision instruments and matched antennas to record how strong the signal was. They repeated this in two ways: once with the transmitter and receiver antennas at the same height, and once with them at different heights, to mimic a variety of practical installations like ceiling‑mounted access points and handheld devices.
Turning Raw Readings into Usable Data
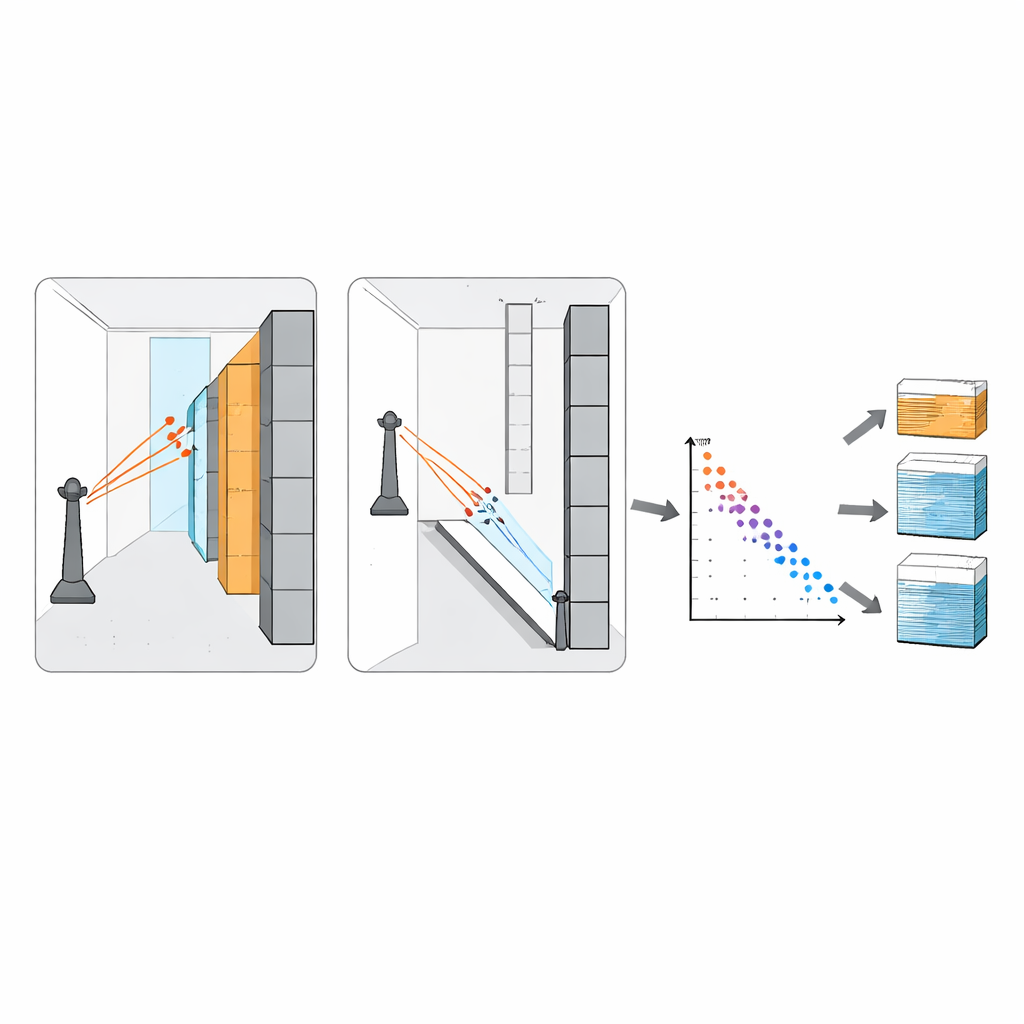
Every spot in each grid came with a full description: its distance from the transmitter, how many brick, glass, wood, or drywall walls lay directly in the path, whether any columns or an elevator were in the way, and the measured signal level. Where it was impossible to take a reading—say, a bookshelf or heavy furniture occupied the exact spot—the team marked those cases and later removed them. After averaging multiple quick samples at each point to reduce random fluctuations, they converted the received power into “path loss,” the total amount of signal reduction between transmitter and receiver. This produced six complete datasets of signal strength and six matching datasets of path loss across the three buildings and two antenna setups.
Checking the Health of the Data
Because these measurements are meant to be reused by other researchers and engineers, the authors put considerable effort into checking data quality. They verified that distances and obstacle counts made physical sense, removed impossible or missing entries, and ensured there were no duplicate records. To see how the different factors relate, they used a statistical technique called Spearman correlation, which can catch both straight-line and gently curved relationships. As expected, signal loss increased with distance, and additional walls of various materials tended to worsen it. The plots also showed a healthy spread of values instead of artificial patterns, suggesting that the measurements capture the rich variety of real indoor conditions.
What Others Can Do with These Measurements
The final datasets are shared openly as simple spreadsheet-style files, each row describing one measurement point and each column giving a feature such as distance, number of walls of each type, and the resulting signal level or loss. With this information, network planners can test and refine formulas that predict coverage inside buildings, compare 3.5 GHz behavior with other frequencies, or design smarter placement of base stations and routers. Data scientists can also apply machine learning methods to build new prediction tools without having to perform their own time‑consuming field campaigns.
How This Helps Your Future Connections
In everyday terms, this work is about making sure your phone, laptop, or smart sensor keeps a strong connection even when you are deep inside a building. By mapping how a 3.5 GHz signal fades as it passes through different room layouts and materials, the authors provide a “truth set” that others can build on. Their measurements confirm that signal loss grows steadily with distance and with each extra wall or obstacle, but now those effects are quantified in detail for realistic indoor settings. As engineers use these public datasets to tune their models and designs, the result should be more reliable 5G service indoors today, and better planning for future 6G networks and the expanding Internet of Things.
Citation: Perdomo-Reyes, P., Galvan-Tejada, G.M. & Meneses-Viveros, A. Path Loss Dataset from Field Measurements at 3.5 GHz for the Fifth Generation of Wireless Communications in Indoor Environments. Sci Data 13, 521 (2026). https://doi.org/10.1038/s41597-026-06650-4
Keywords: 5G indoor coverage, wireless path loss, 3.5 GHz measurements, radio propagation data, indoor wireless networks