Clear Sky Science · en
Dataset for Comprehensive Analysis of Desiccation Cracks in Soils
Why Cracked Soil Matters to Everyday Life
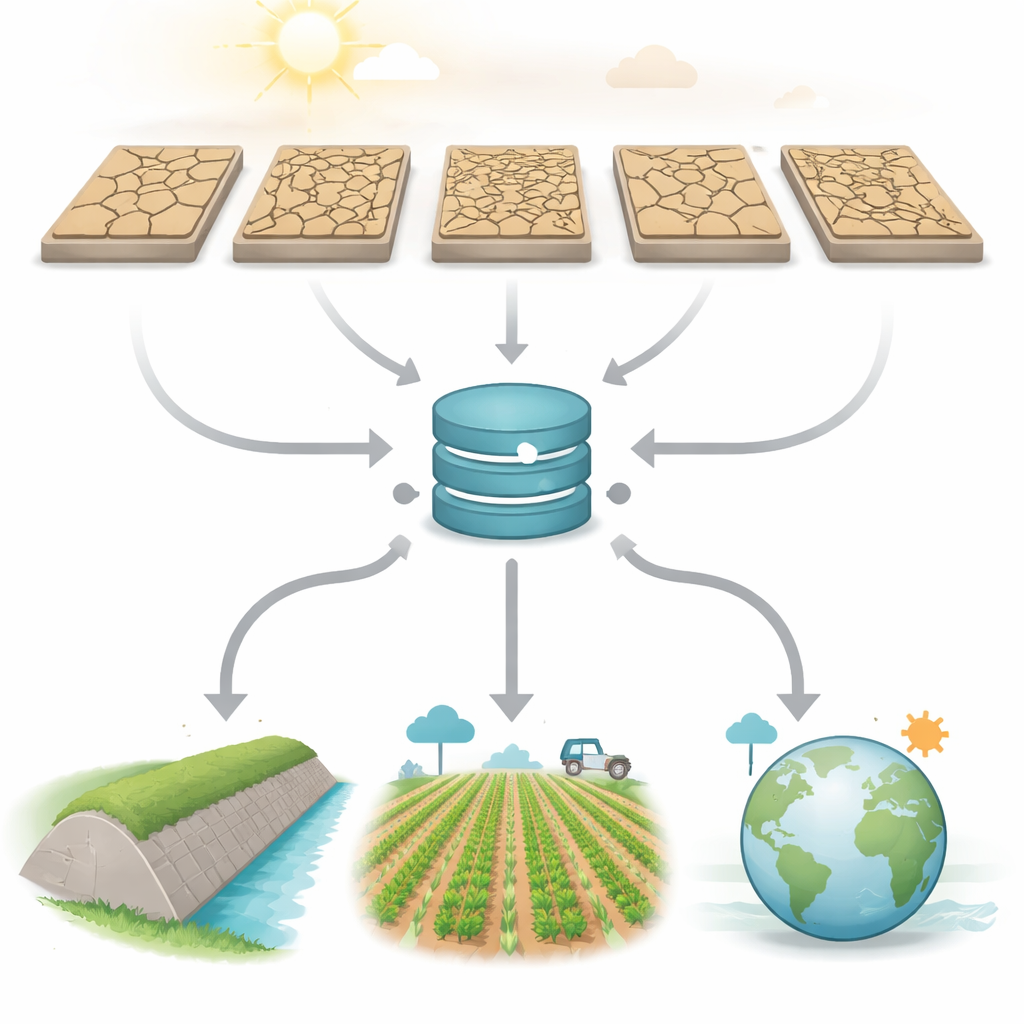
Anyone who has walked across a dried field or seen parched earth on the news has noticed the spider‑web of cracks that can appear in soil. These cracks are more than a visual sign of drought: they can weaken dams and levees, alter how crops get water, and even change how pollution or greenhouse gases move through the ground. This article introduces D‑CRACKS, a new open dataset that gathers and analyzes images of cracked soil from many experiments worldwide, giving engineers, farmers, and environmental scientists a shared foundation for understanding and predicting this hidden but powerful process.
Bringing Scattered Soil Studies Into One Place
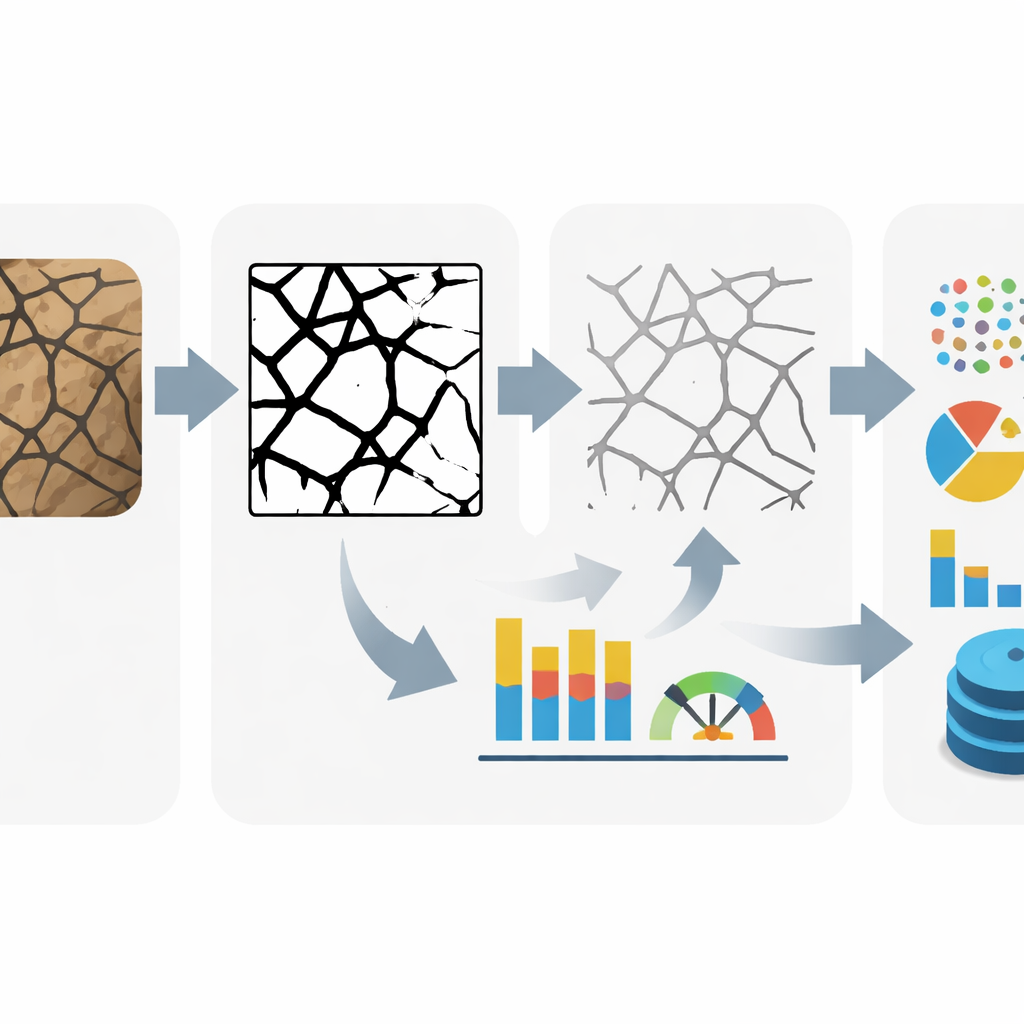
Until now, research on soil cracking has been spread across dozens of separate laboratory studies, each using its own test set‑up and reporting style. The authors combed through the scientific literature using major research databases to find high‑quality experiments where soil samples were dried in controlled conditions and photographed as cracks formed. From 41 independent studies, they compiled 1,000 images that capture how cracks grow under different soils, temperatures, humidities, sample shapes, and added stabilizing materials such as fibers or bio‑treatments. Instead of re‑publishing the original photos, they converted each one into a simplified black‑and‑white representation showing only the crack pattern, and linked it to detailed information about how the test was done.
How Cracked Soils Were Cleaned and Measured
To make the images comparable, the team carried out a careful cleaning and processing pipeline. They first standardized the pictures, cropping away rulers, labels, and other objects so that only the soil surface remained. When lighting or camera angle made cracks hard to distinguish from the background, they adjusted brightness and contrast and checked image quality using common Python tools. Next, specialized software called the Crack Image Analysis System turned each image into a clear map of black cracks on a white background, sometimes aided by an AI model to find the sharpest separation between cracked and uncracked areas. The software then traced the centerlines of the cracks, removed tiny false branches, and calculated key measures such as total crack length, average crack width, fraction of the surface that was cracked, and a "complexity" score that captures how intricate the crack network is.
What the Numbers Say About Soils and Their Cracks
Once the cracks were converted into numbers, the authors stored everything in a structured database with 51 different columns, covering testing conditions, soil make‑up, sample geometry, environment, and any additives. This allowed them to look for broad patterns across hundreds of samples. Most of the tests involved clay‑rich soils, which are notorious for shrinking when they dry. The dataset confirms long‑standing field wisdom with precise ranges: clays that are more plastic and hold more water tend to develop larger cracked areas and longer, wider cracks, while less plastic clays crack less severely. When the share of clay‑sized particles in the soil is high, the crack networks become more extensive and complex. The way the sample is shaped and supported also matters: circular pans, thicker layers, and rough or porous bases can change how stresses build up and how the crack patterns spread.
Climate, Repeated Drying, and Soil Treatments
The dataset also sheds light on how weather‑like conditions shape cracking. Higher temperatures and lower relative humidity drive faster drying and generally lead to more intense cracking, while moister air slows the process and limits crack growth. Repeated cycles of wetting and drying, or of freezing and thawing, cause the soil structure to evolve, with cracks growing more extensive over the first few cycles before eventually stabilizing. D‑CRACKS tracks hundreds of such cycles, helping clarify when damage tends to level off. The database further records nearly six hundred tests in which soils were mixed with fibers, bio‑cement, or other stabilizers. These additives often act like tiny reinforcing bars, spreading out stresses and reducing how far and how wide cracks can grow, a promising avenue for protecting infrastructure and farmland in a warming climate.
Why This Dataset Is a Launch Pad for Future Tools
By turning messy photos and scattered reports into a clean, searchable resource, D‑CRACKS gives researchers a common starting point for building and testing new models of soil cracking. Because every crack pattern is paired with rich background information, the dataset is well suited for both physics‑based simulations and modern machine‑learning methods that can uncover subtle, nonlinear links between soil type, environment, and crack behavior. While it currently focuses mainly on two common kinds of clay, it already offers the largest standardized collection of its kind and is designed to grow as new experiments are added. For non‑specialists, the key takeaway is that we now have a powerful shared map of how and when soils crack—one that can ultimately help safeguard infrastructure, crops, and the environment as climate stresses intensify.
Citation: Asadian, A., Vahedifard, F. & Tang, CS. Dataset for Comprehensive Analysis of Desiccation Cracks in Soils. Sci Data 13, 552 (2026). https://doi.org/10.1038/s41597-026-06632-6
Keywords: soil cracking, desiccation, clay soils, geotechnical data, machine learning