Clear Sky Science · en
A comprehensive UK crop yield dataset incorporating satellite, weather, and soil type information
Why this matters for our food future
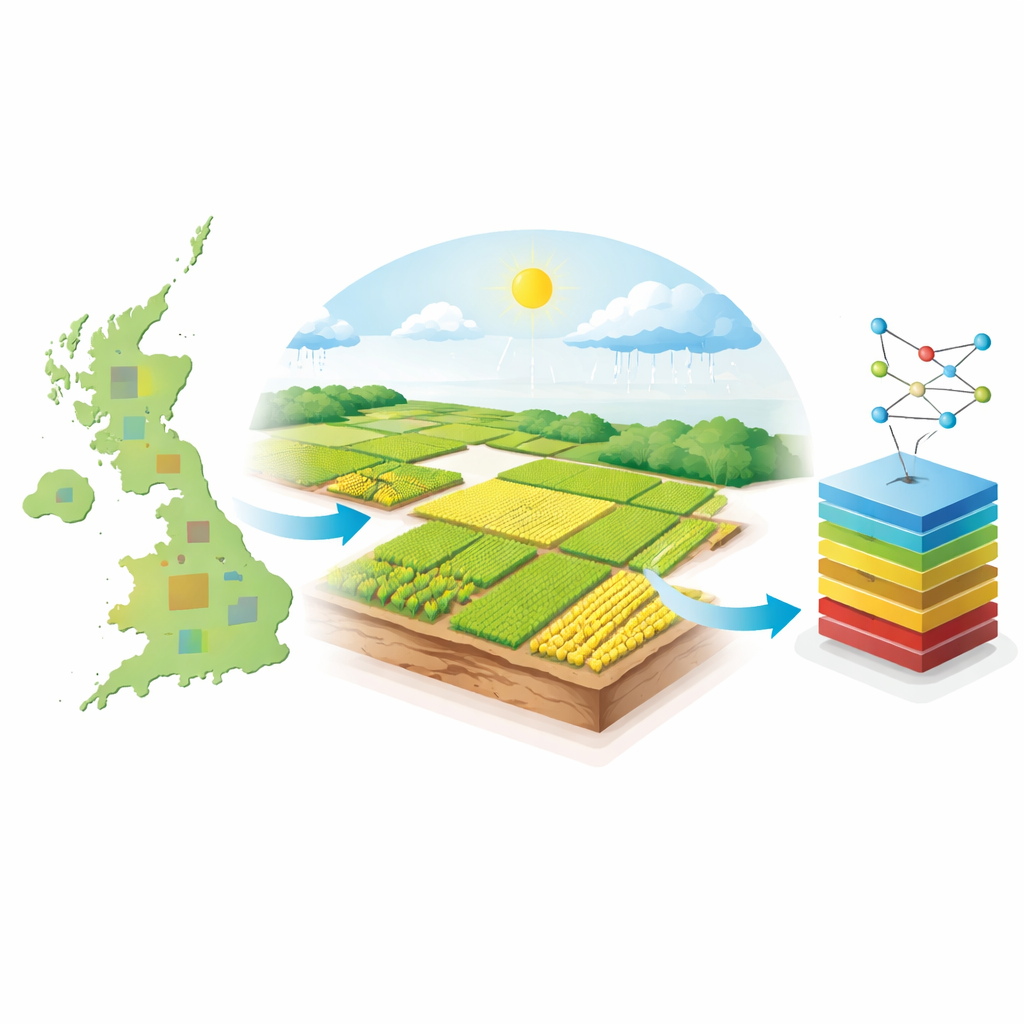
How much food a country can grow depends not just on weather, but on the subtle interplay of climate, soil, and day‑to‑day conditions in farmers’ fields. Until now, researchers in the United Kingdom have lacked a large, open dataset that links what actually came off the combine harvester to detailed measurements from satellites and weather stations. This paper introduces such a resource, called the CYCleSS dataset, which brings together crop yields, climate, soils, and satellite observations for hundreds of fields across England. It gives scientists, policymakers, and even agri‑tech companies a new way to understand and predict harvests in a warming, more uncertain world.
Bringing many pieces of the farm puzzle together
The authors created CYCleSS by starting from “ground truth” yield data collected by modern harvesters on 934 fields across England between 2015 and 2017. These machines routinely record how much grain is collected at fine spatial resolution, but those data usually stay on the farm because they are commercially sensitive. The team worked with the UK Centre for Ecology and Hydrology and other partners to anonymize this information so that no individual farm could be identified, while still keeping it accurate enough to be scientifically useful. Alongside the yield, they recorded which crop was grown in each field, mainly winter wheat, oilseed rape, and barley, as well as beans.
Weather, soil, and satellites on the same map
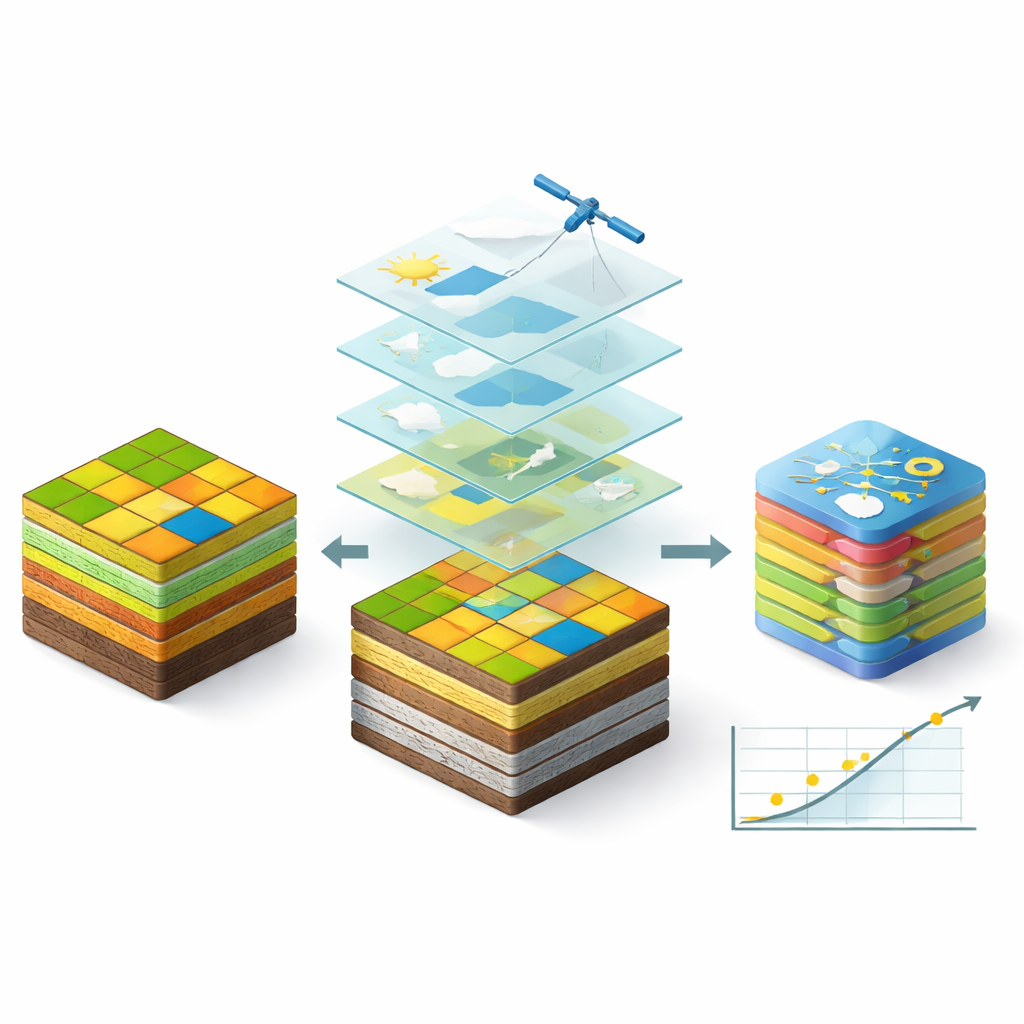
To understand why yields vary, the dataset combines several other strands of information, all aligned on a grid of one‑kilometre squares. Daily weather records, such as temperature, rainfall, sunshine, wind, air pressure, and evaporation, were drawn from national climate archives that cover all of Great Britain. Soil properties, including how much water the soil can hold, how fast it drains, and the mix of sand, silt, and clay, were added from European‑scale soil maps. The researchers then filtered this grid to keep only areas actually used for arable farming, using a detailed land‑cover map that distinguishes different crop types at a 10‑metre resolution.
Watching crops grow from space
A key strength of CYCleSS is the integration of satellite data with field yields. Using a cloud‑computing platform, the team extracted time series of radar measurements from the European Sentinel‑1 mission for each selected grid square. Radar has the advantage of working through clouds and at night, and its signals change as crops develop more leaves and biomass. For every 10‑metre satellite pixel within the chosen areas, the researchers gathered radar readings every five days in two different polarisations and their ratio, which are known to be sensitive to crop type and growth stage. These pixel‑level signals were then averaged up to the field scale and linked to the matching yield and management information.
Keeping farmers anonymous while keeping data useful
Because yield maps are tied directly to farmers’ livelihoods, privacy was a central concern. To protect contributors, the authors introduced a two‑team process. One team handled the satellite, soil, and climate alignment on a fine grid; a separate team at UKCEH matched those grids to actual fields and yields, then stripped out precise locations. Fields were ultimately identified only by random codes and by the coarser 10‑kilometre grid squares they sit within. This means that any one square contains many farms, making it practically impossible to link a particular yield record back to a specific business, yet the scientific link between environment and yield is preserved.
What this enables for farming and climate resilience
The CYCleSS dataset opens the door to much more powerful models of crop performance in the UK. Because it joins real harvest outcomes to rich streams of weather, soil, and satellite measurements, it is ideal for training and testing machine‑learning tools, such as deep neural networks, that need large, well‑structured datasets. It can also be used to check and improve traditional crop growth models and to explore ways of combining these models with satellite observations in near real time. Although the data come mainly from better‑equipped farms in southern England and still carry some measurement uncertainties, they offer a rare, openly accessible window into how UK crops respond to their environment, helping researchers design more reliable yield forecasts and inform efforts to make farming both productive and sustainable.
Citation: Corcoran, E., Bebber, D.P., Curceac, S. et al. A comprehensive UK crop yield dataset incorporating satellite, weather, and soil type information. Sci Data 13, 491 (2026). https://doi.org/10.1038/s41597-025-06528-x
Keywords: crop yield prediction, satellite remote sensing, agricultural data, UK farming, machine learning