Clear Sky Science · en
Transcribing historical Canadian weather data
Why Old Weather Still Matters Today
When we think about climate change, we usually picture satellites, supercomputers, and modern weather stations. But to understand how our climate has really changed over centuries, scientists need to reach much further back in time—into a world of ink, paper, and careful daily notes. This study describes how nearly two million handwritten weather observations from across what is now Canada, recorded between 1768 and 1884, have been painstakingly turned into digital data that computers can read and climate models can use.
Hidden Weather in Old Paper Records
Long before national weather services existed, military officers, doctors, teachers, and other volunteers across British North America carefully wrote down the daily weather. Their notebooks and pre-printed forms ended up in archives in the United States and the United Kingdom rather than in Canada. The NORTHERN project (Nineteenth-century Overseas Records Transcribed for Historical Environmental Reconstruction in the North) set out to find and rescue these scattered records. Working mainly with microfilmed pages from U.S. and U.K. archives, the team identified 46 locations—from Atlantic ports to remote trading posts in the northwest—where observers had logged three to twenty weather variables, often several times a day. These notes capture not only temperature and pressure but also storms, floods, ice breakup, fires, and other events that shaped daily life.
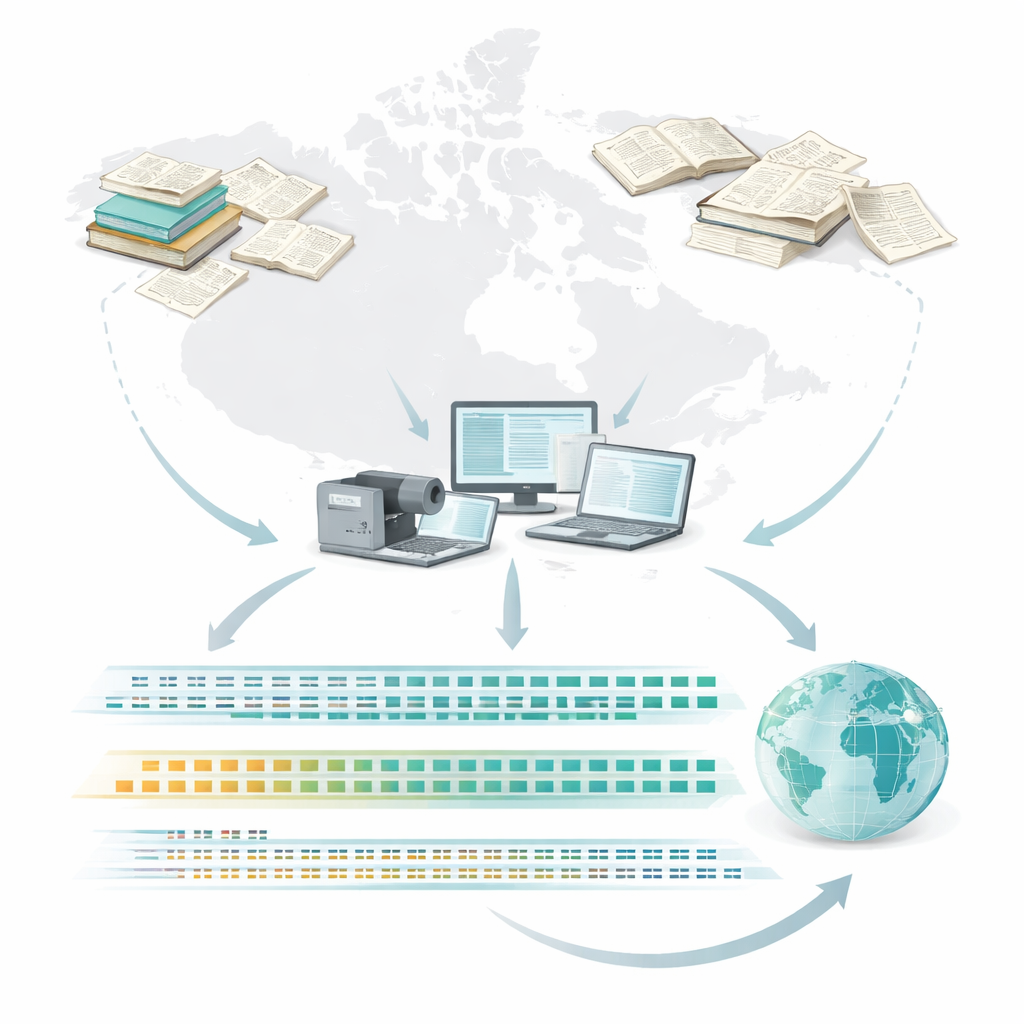
Turning Handwriting into Data
Rescuing this information meant more than just scanning old pages. The team built a dedicated web-based transcription system where digitized images of weather registers could be displayed and their numbers typed directly into a structured database. They catalogued different kinds of forms and page layouts, so that the digital entry screens would mimic the original tables. Volunteers selected cloud types and wind directions from controlled menus to reduce typing errors, while free-text boxes handled numbers like temperature and pressure. Each image file received a carefully designed name linking it to its station, date, observer, and archive, so that any digital value could always be traced back to a specific line on a specific page.
Cleaning and Checking the Numbers
Because these observations were made with older instruments and varied habits, the raw numbers could not simply be copied and used. The researchers ran the transcribed data through several layers of quality checks. First, specialists visually compared database tables against the page images to catch obvious slips such as missing days or misplaced decimals. Then computer programs scanned for impossible or suspicious values—temperatures far outside any reasonable range, or wind forces beyond the scale the observer was meant to use. Where observers had written fractions, shorthand marks, or left out leading zeros, the software converted or corrected them while logging every change. The team also compared related measurements with one another; for example, minimum temperatures should be lower than maximum ones, and corrected air pressure should usually exceed the raw station reading. Values that still looked odd were flagged rather than erased, keeping the record honest.
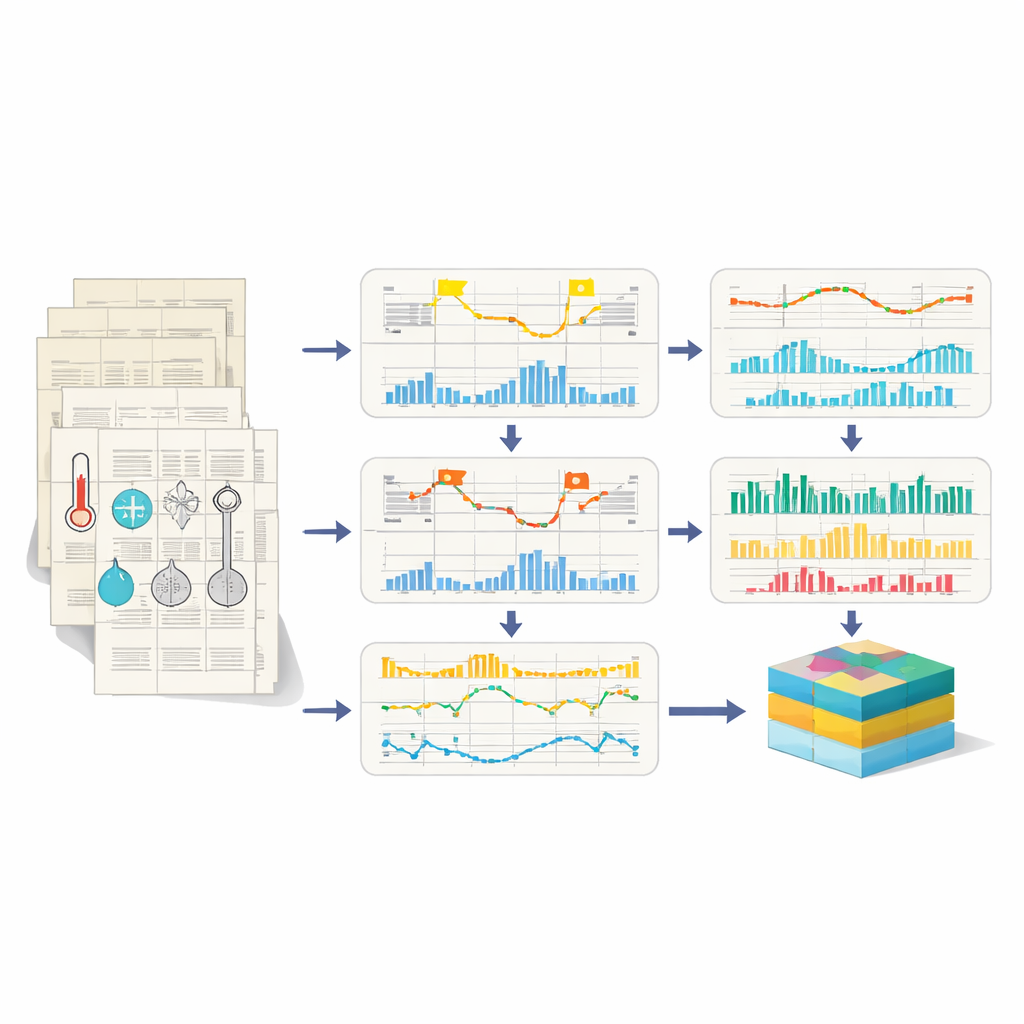
Bridging Old Units and Modern Standards
Another major challenge was that nineteenth-century observers did not think in today’s units. They recorded pressure in inches of mercury, temperature in degrees Fahrenheit, cloud cover in tenths, and wind in a mixture of descriptive scales, speeds, and even pounds of force on a plate. To make these records comparable with modern weather data, the team converted them into international standards such as degrees Celsius, hectopascals, and metres per second, drawing on historical instruction manuals and modern conversion libraries. Some details, like the exact strength of a “fresh breeze” on an old wind scale or the wording of weather remarks, cannot be translated perfectly, so these are preserved as carefully coded approximations rather than forced into neat categories.
A New Window on Centuries of Canadian Weather
The end result of this effort is a publicly available dataset hosted by the U.S. National Centers for Environmental Information. It includes sub-daily records of temperature, pressure, wind, clouds, humidity, precipitation, and descriptive weather notes from 1768 to 1884 across much of present-day Canada. These data will help scientists study long-ago heat waves, cold snaps, storms, and other extreme events, and they will feed into global “reanalysis” projects that reconstruct past weather patterns using modern physics-based models. For non-specialists, the project shows how fragile, forgotten notebooks can be transformed into powerful tools for understanding how our climate has varied over three centuries—and how today’s changes compare with the full sweep of Canada’s weather history.
Citation: Slonosky, V., Black, R., Podolsky, L. et al. Transcribing historical Canadian weather data. Sci Data 13, 678 (2026). https://doi.org/10.1038/s41597-025-06036-y
Keywords: historical weather data, Canadian climate, data rescue, climate extremes, weather archives