Clear Sky Science · en
Water isotope–temperature relationship variability across Antarctica set by atmospheric circulation
Reading the past in Antarctic ice
Scientists use the tiny differences in water molecules frozen in Antarctic ice to read Earth’s climate history, much like tree rings record past weather. This study explains why the link between those water “fingerprints” and air temperature is not as simple as once thought, and how understanding the winds that carry moisture to Antarctica can sharpen our view of past climate changes.
Why special water molecules matter
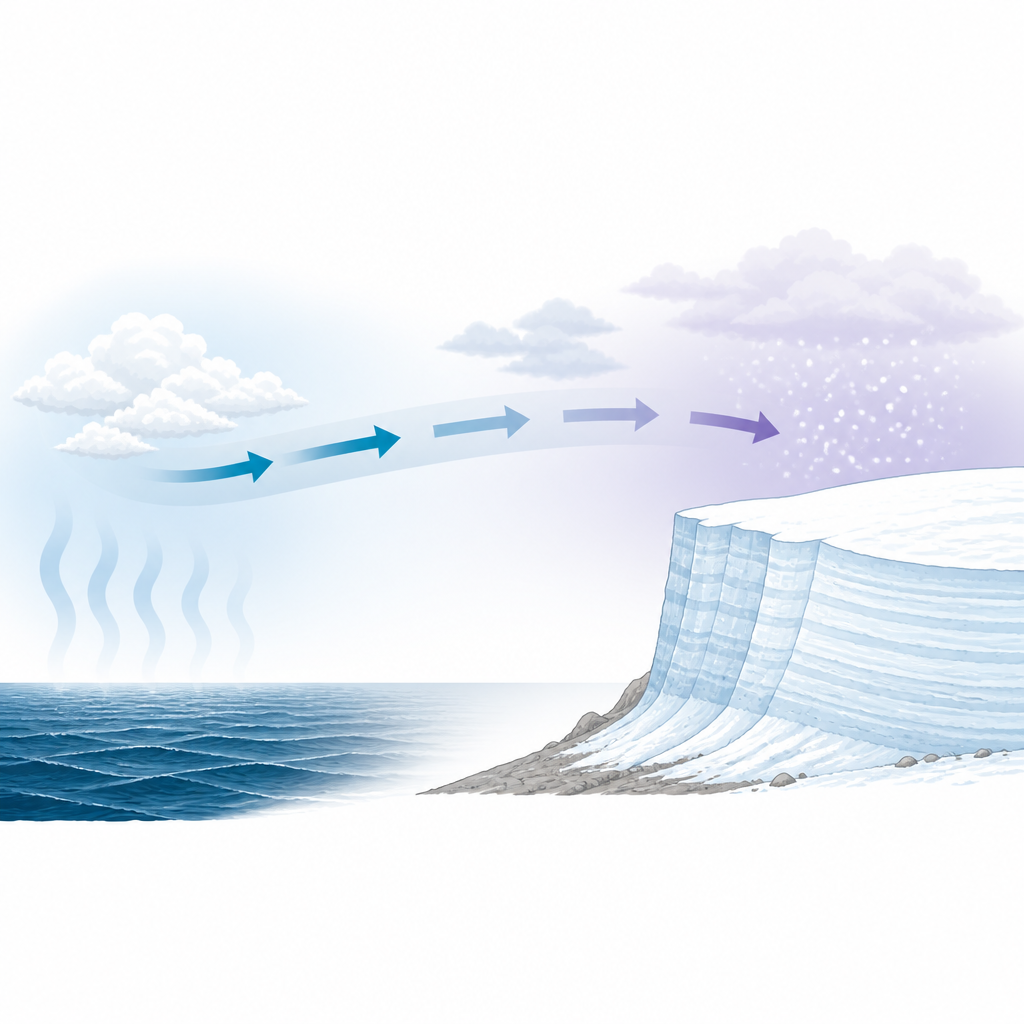
Water is made of hydrogen and oxygen, but not every molecule is exactly the same. A small fraction carry slightly heavier versions of these atoms, called heavy isotopes. When seawater evaporates, travels through the atmosphere and finally falls as snow over Antarctica, the mix of light and heavy water shifts in a predictable way. For decades, scientists have used this pattern in ice cores to estimate how cold it was when the snow fell. Yet measurements across Antarctica have revealed that the strength of the link between isotopes and temperature changes from place to place and from year to year, raising doubts about using a single rule to convert isotope data into past temperatures.
Following moisture across a frozen continent
To tackle this puzzle, researchers carried out a summer traverse across East Antarctica, driving more than 3,000 kilometers from the coastal station Dumont D’Urville up to the high interior at Dome C and beyond. Along the way, they continuously measured the isotopic makeup of water vapor in the air, and they combined these readings with existing data from falling snow and ice cores. Because vapor and precipitation originate from the same air masses, tracking vapor lets scientists watch the distillation of moisture as it moves inland, without the noise added later by patchy snowfall or changes to the snow surface.
Space and time tell different stories
The team compared how isotopes and temperature are linked in two ways: across space, moving from the relatively mild coast to the frigid interior, and across time, as seasons change at a single site. They confirmed that the isotope–temperature relationship is much steeper in space than in time. In other words, shifting a thousand kilometers inland changes the isotope signal far more than warming or cooling by a few degrees at one station. Their analysis shows that this difference arises because inland sites like Dome C are fed by air that has already lost most of its moisture as snow along the journey from the ocean, leaving the remaining vapor strongly depleted in heavy isotopes.

Moist pathways in the sky
To explain these patterns, the researchers turned to a simple physical picture of how air moves. Instead of focusing only on latitude, they followed “moist pathways” in the atmosphere that roughly conserve a quantity related to heat and humidity. Along these paths, moisture is gradually squeezed out as snow, and the isotopes change in a way similar to distilling a liquid. By tracing the temperature and isotope evolution along such paths in several climate models, they could reproduce both the weaker temporal slopes and the stronger spatial slopes seen in the real-world data. This shows that large-scale atmospheric circulation, not just local weather quirks, controls how isotopes respond to temperature over Antarctica.
Rethinking temperature from ice cores
The findings carry important lessons for reading Antarctic ice cores. They suggest that there is no single, timeless conversion factor between isotopes and temperature. Instead, the slope depends on how far air has traveled from its moisture source, how much snow has already fallen along the way and the broader climate state, such as how strong the temperature contrast is between the poles and the equator. Over very long periods, changes in sea ice, ice sheet height and storm tracks can shift these moist pathways and alter the isotope–temperature link. The study argues that ice core reconstructions should use a continuum of relationships guided by atmospheric physics and supported by other temperature clues, such as borehole measurements and gas isotopes.
What this means for our climate story
By tying the isotope signals in Antarctic ice directly to the way moisture is carried and cooled in the atmosphere, this work provides a clearer map for turning ice layers into past temperatures. For non-specialists, the key message is that Antarctic ice still offers a powerful record of Earth’s climate, but it must be decoded with an eye on the moving air above, not just the snow below. Understanding these airborne pathways helps scientists build more reliable histories of how our planet has warmed and cooled, which in turn improves the tools used to anticipate future climate change.
Citation: Casado, M., Bailey, A., Leroy-Dos Santos, C. et al. Water isotope–temperature relationship variability across Antarctica set by atmospheric circulation. Nat. Geosci. 19, 581–588 (2026). https://doi.org/10.1038/s41561-026-01961-y
Keywords: Antarctica, ice cores, water isotopes, atmospheric circulation, paleoclimate