Clear Sky Science · en
An unprecedented view of ocean currents from geostationary satellites
A new way to watch the restless sea
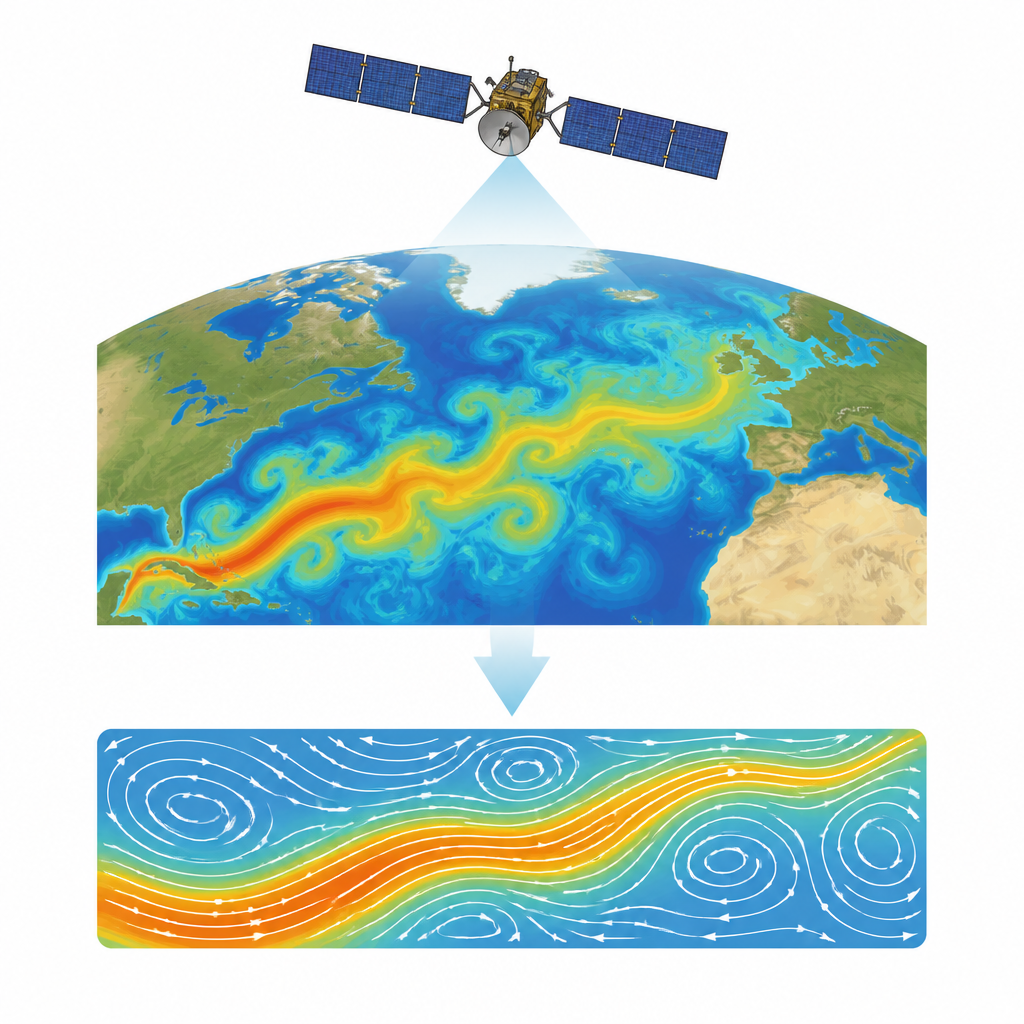
The ocean’s surface is crisscrossed by narrow jets and tiny whirlpools that quietly shape our weather, climate, and marine life. Yet these fast changing currents have been almost invisible to satellites. This study introduces a method called Geostationary Ocean Flow, or GOFLOW, which turns continuous infrared images from weather satellites into detailed, hourly maps of ocean surface currents, opening a new window on how the upper ocean really moves.
Why small currents matter so much
At first glance, the ocean seems dominated by huge features such as major currents and warm and cold pools of water that can last for months. But tucked inside are smaller streaks, fronts, and eddies only a few kilometers wide that spin up and die out within a day. These fine scale flows shuttle heat, carbon, and nutrients between the surface and deeper layers, and they steer floating material such as oil spills and plastic debris. Until now, our main satellite tools have been too coarse in space and too slow in time to capture this restless small scale motion, leaving a major gap in how we observe and predict the ocean.
Limits of existing satellite views
Traditional satellite missions measure the height of the sea surface as they orbit the planet every week or so, allowing scientists to infer broad current patterns. Newer missions can see smaller ripples in sea level, but they still revisit the same spot only every few weeks and their snapshots are polluted by signals from internal waves that have little to do with long lived currents. Other approaches try to track surface temperature features directly from images, but either rely on rare, sharp fronts or struggle with gaps from clouds and with heating and cooling from the atmosphere that complicate the pattern. As a result, existing maps blur out the very structures that dominate short term stirring near the surface.
Teaching satellites to feel the flow
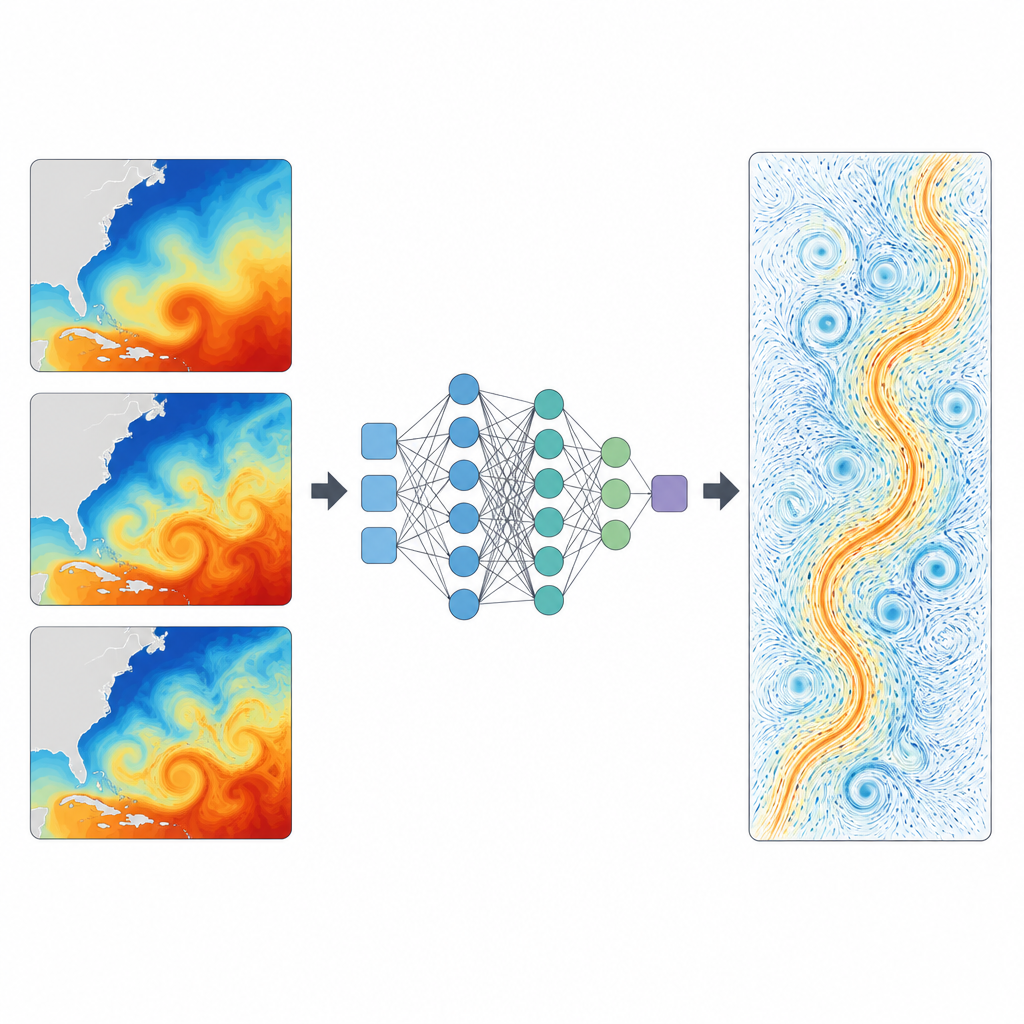
GOFLOW takes advantage of a different kind of satellite: geostationary weather platforms that stare continuously at the same region of Earth. They record hourly infrared images of sea surface temperature at kilometer scale resolution across vast ocean basins. Instead of using temperature itself, the authors feed a neural network with how strongly temperature changes from place to place, which highlights a rich web of strong and weak fronts across the ocean’s surface. A U shaped deep learning architecture is trained on a very high resolution computer simulation of the Atlantic, learning how sequences of three hourly images of this web evolve when pushed around by currents. Once trained, the system can turn real satellite imagery into an instantaneous map of surface velocity, without assuming that the flow follows simplified balances.
Testing the new ocean maps
The researchers applied GOFLOW to the Gulf Stream, one of the most energetic currents in the North Atlantic. Compared with standard satellite based products, the new maps show sharp, coherent eddies and filaments instead of smeared patches. They line up closely with fine details visible in the temperature images and remain much cleaner than results derived from a recent high resolution sea level mission, which is strongly affected by internal waves. When checked against direct ship based current measurements and drifting instruments at sea, the GOFLOW estimates match both the speed and direction of the currents remarkably well. The method also yields fields that older techniques simply cannot provide, such as maps of where the surface is converging or spreading apart, a key driver of vertical motion between the surface and the ocean interior.
What the statistics reveal about turbulence
Because GOFLOW delivers dense, hourly velocity fields, the team could compute statistical fingerprints of small scale turbulence over a wide area of the Gulf Stream. They found strong imbalances between clockwise and counterclockwise spinning motions and between regions of convergence and divergence, patterns that are signatures of ageostrophic flows known to energize vertical exchange. These signatures had previously appeared mainly in high resolution computer models and specialized field campaigns. The kinetic energy across different sizes of motion shows that GOFLOW captures a broad range of scales down to about ten kilometers, and that its view of how energy is spread across these scales agrees with direct ship based estimates.
What this means for people and the planet
In plain terms, GOFLOW turns existing weather satellites into powerful eyes for tracking fine scale ocean currents in near real time. While clouds still create gaps and the method inherits some limits from the simulations used for training, it already surpasses current global products in sharpness and detail. By supplying the rapid, high resolution data that next generation climate and weather models need, this approach can improve forecasts of heat transport, air sea interaction, and the paths of pollutants or nutrients. It brings scientists closer to a true movie of the ocean’s surface, rather than a series of blurred snapshots.
Citation: Lenain, L., Srinivasan, K., Barkan, R. et al. An unprecedented view of ocean currents from geostationary satellites. Nat. Geosci. 19, 526–533 (2026). https://doi.org/10.1038/s41561-026-01943-0
Keywords: ocean currents, satellite observations, deep learning, Gulf Stream, submesoscale turbulence