Clear Sky Science · en
Incongruent melting and phase diagram of SiC from machine learning molecular dynamics
Why this matters for everyday technology and distant worlds
Silicon carbide is already a workhorse of modern technology, powering high‑efficiency electronics, harsh‑environment sensors, and parts for nuclear reactors. It also appears in the scorching interiors of some exoplanets. Yet scientists have long disagreed on a basic question: when silicon carbide is heated and squeezed hard enough, does it melt as a single uniform substance, or does it break apart into separate silicon and carbon phases first? This study uses advanced computer simulations driven by machine learning to settle that debate and map out how silicon carbide behaves under extreme heat and pressure.
A tough material with a puzzling melting behavior
Silicon carbide is prized because it is hard, conducts heat well, and can handle high voltages, making it central to power electronics and potential next‑generation nuclear systems. Its behavior at thousands of degrees and immense pressures is also key for understanding carbon‑rich exoplanets, where silicon carbide may be a major rock‑forming material. For decades, experiments have given conflicting answers about what happens when silicon carbide “melts.” Some measurements suggested it melts like a pure substance; others hinted that it instead decomposes into liquid silicon and solid carbon. These tests are notoriously difficult: tiny samples are heated with lasers in diamond anvils, temperatures are hard to measure, and even small impurities or uneven heating can change the outcome.
Teaching a computer to follow atoms under extreme conditions
To cut through the confusion, the authors used a new style of simulation that blends quantum‑level accuracy with the speed of machine learning. They first ran many small, accurate quantum calculations describing how silicon and carbon atoms push and pull on each other under different conditions. A machine‑learning “force field” was then trained on this data using a Bayesian active learning scheme: whenever a simulation wandered into a configuration where the model was uncertain, new quantum calculations were added to refine it. This self‑guided approach produced a highly reliable model that could follow hundreds of thousands of atoms for nanoseconds of simulated time—something far beyond the reach of traditional quantum simulations.
Watching silicon carbide break apart and come back together
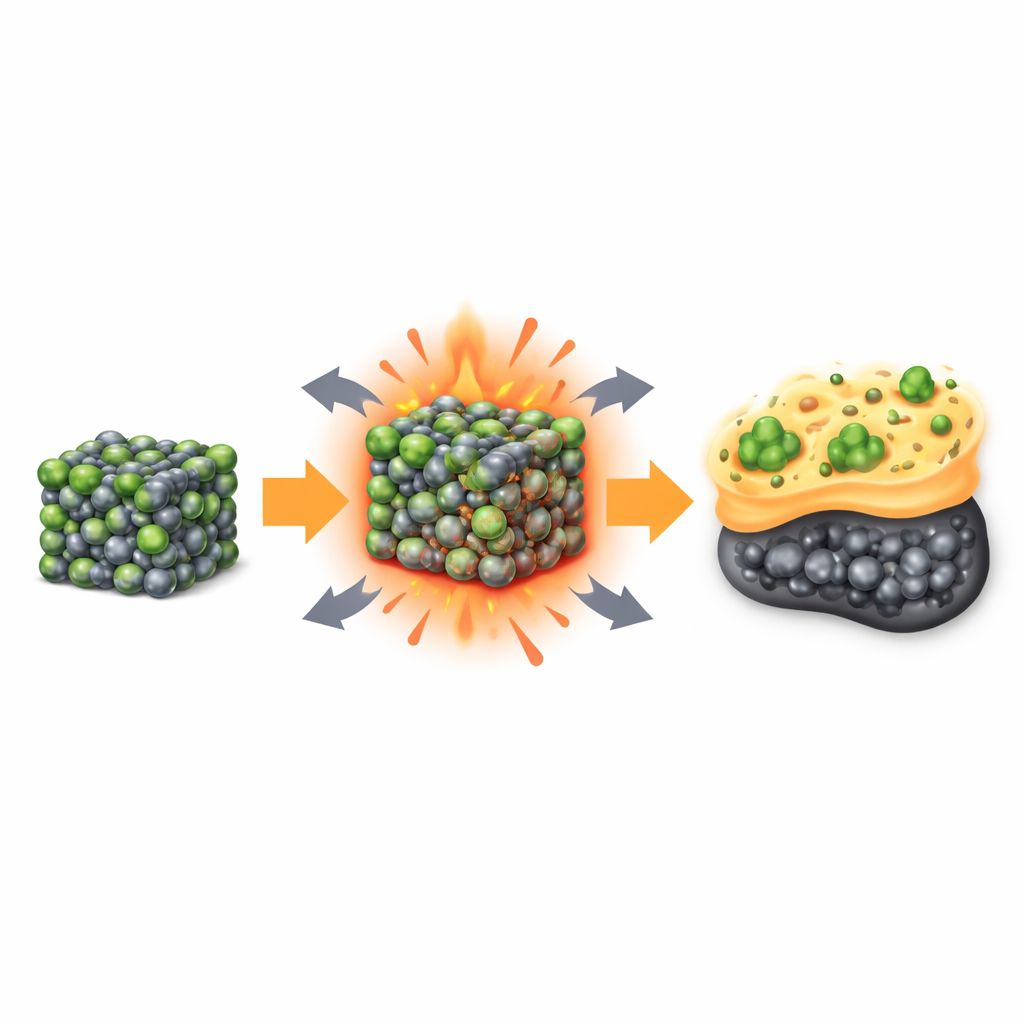
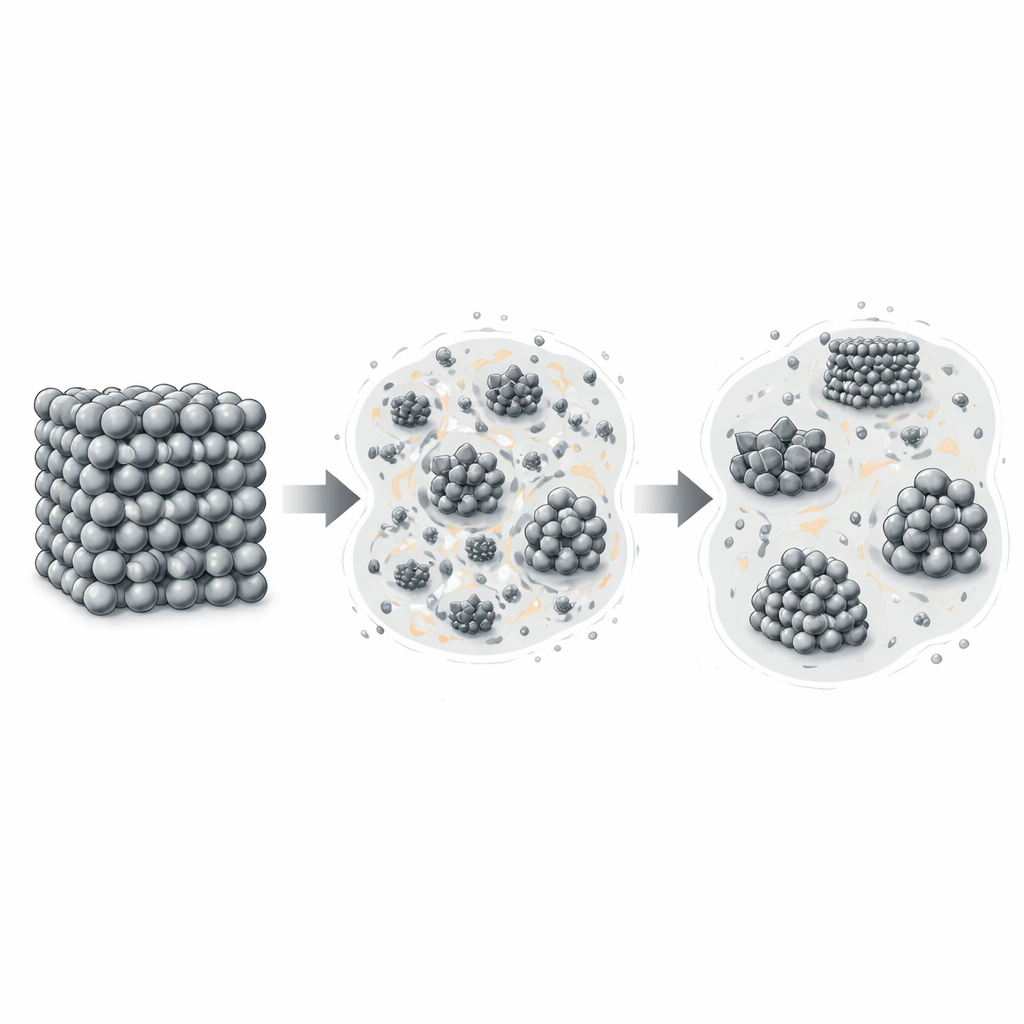
Armed with this force field, the team heated and cooled very large virtual crystals of silicon carbide at pressures up to 120 gigapascals, comparable to deep planetary interiors. At high temperatures, the ordered crystal first became a homogeneous liquid containing a well‑mixed blend of silicon and carbon atoms. As the liquid was cooled at high pressure, tiny carbon‑rich pockets appeared and grew into nanometer‑scale clusters with structures resembling graphite or diamond, surrounded by a silicon‑rich liquid. Under some conditions, a high‑pressure form of silicon carbide also appeared alongside these phases. When the system was heated again, these carbon clusters dissolved back into a uniform silicon‑carbide liquid at around 4000 kelvin, showing that the process is reversible.
From snapshots to a full map of states
To pinpoint where each transformation happens, the researchers designed “two‑phase” simulations in which two states—such as a crystal and a decomposed mixture—are placed in contact and allowed to evolve until neither side grows at the expense of the other. The temperature at which this balance holds marks the true phase boundary. Repeating this protocol over a wide range of pressures revealed when the familiar crystal structure gives way to the decomposed mixture, and when that mixture turns into a fully mixed liquid. Combining these results with earlier work on other transformations, the authors built a complete pressure‑temperature phase diagram for silicon carbide, including regions where it sublimates into gas at low pressure, changes crystal structure, decomposes, or forms a homogeneous melt.
What the findings mean for industry and space
The simulations show that under high pressures, silicon carbide does not melt as a single, uniform substance. Instead, it decomposes into liquid silicon and solid carbon before eventually becoming a homogeneous liquid at even higher temperatures. This “incongruent melting” explains why past experiments have disagreed and lines up well with several independent high‑pressure studies. It also implies that making glassy, amorphous silicon carbide by simply melting and quenching is unlikely; instead, approaches like irradiation are needed, matching what many experiments observe. For technologists, the new phase diagram provides guidance for high‑temperature processing, crystal growth, and graphene production from silicon carbide. For planetary scientists, it offers a more reliable picture of how this material behaves deep inside carbon‑rich worlds, where it may help control heat flow and internal structure.
Citation: Xie, Y., Wang, M., Ramakers, S. et al. Incongruent melting and phase diagram of SiC from machine learning molecular dynamics. npj Comput Mater 12, 125 (2026). https://doi.org/10.1038/s41524-026-01976-4
Keywords: silicon carbide, high pressure, melting, machine learning simulation, phase diagram