Clear Sky Science · en
Explainable time-series forecasting with sampling-free SHAP for Transformers
Why smart forecasts need to be understood
From planning the power grid to setting tomorrow’s electricity prices, many decisions rely on computer models that predict how numbers change over time. These models have become extremely powerful, but also harder to understand, which can make people wary of trusting them in critical areas like energy systems. This paper presents SHAPformer, a forecasting approach that not only makes accurate predictions but also clearly shows which pieces of past information most influenced each forecast.
How forecasting can become a black box
Modern time-series forecasting often uses deep learning, especially Transformer models originally built for language translation. They can handle many inputs, such as past electricity demand, weather, and calendar information, and learn complex patterns from vast datasets. Yet their inner workings are largely hidden, so users cannot easily see why a particular prediction was made. This lack of transparency matters in practice, because grid operators, regulators, and businesses increasingly demand explanations before relying on model outputs that could affect costs, safety, or compliance.
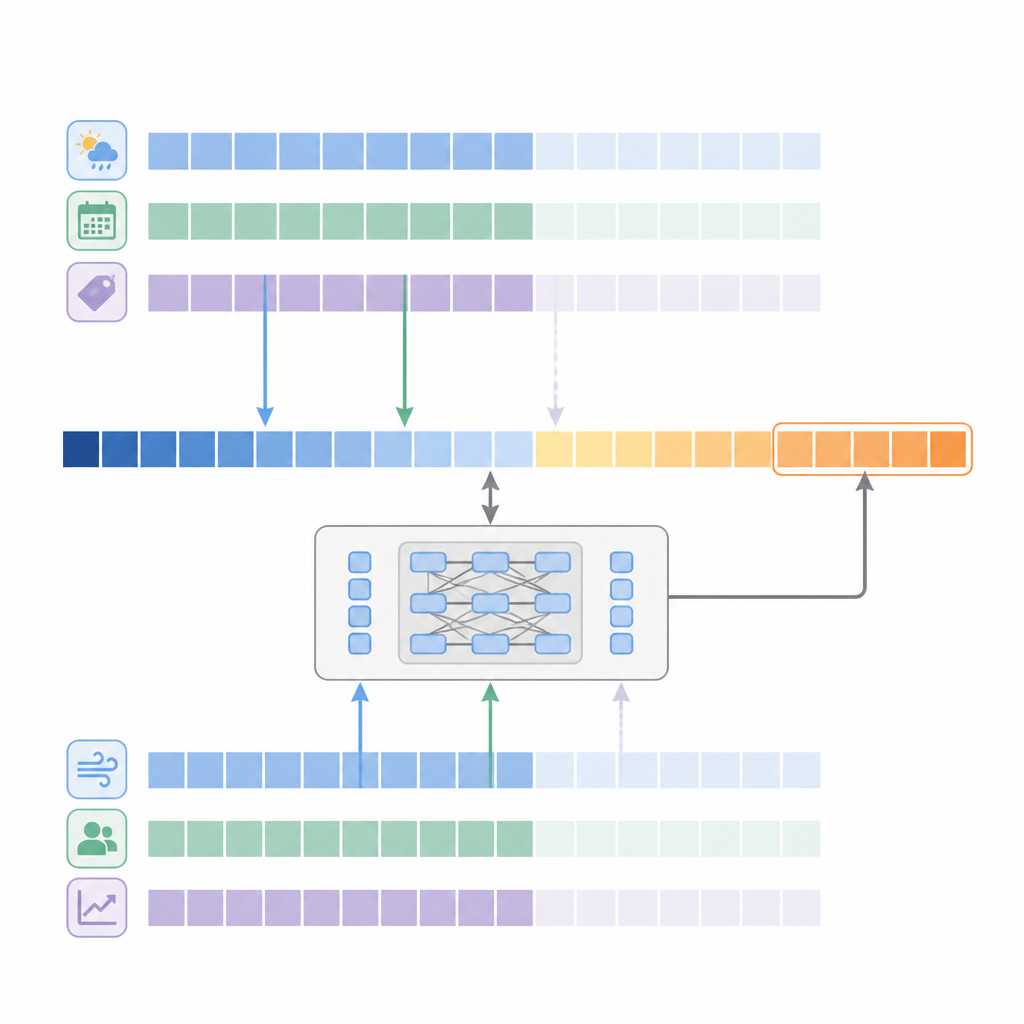
A way to share credit fairly among inputs
One popular family of explanation tools is based on the idea of fairly sharing credit among inputs. In this view, each feature, such as yesterday’s demand or today’s temperature, is treated like a player in a cooperative game, and the model’s prediction is the outcome of that game. Shapley-based methods, grouped under the name SHAP, estimate how much each feature contributes on average by comparing predictions with and without that feature. Existing SHAP tools for time series, however, usually rely on sampling many artificial examples or replacing missing inputs with baseline values, both of which can be slow and may create unrealistic scenarios that distort the explanation.
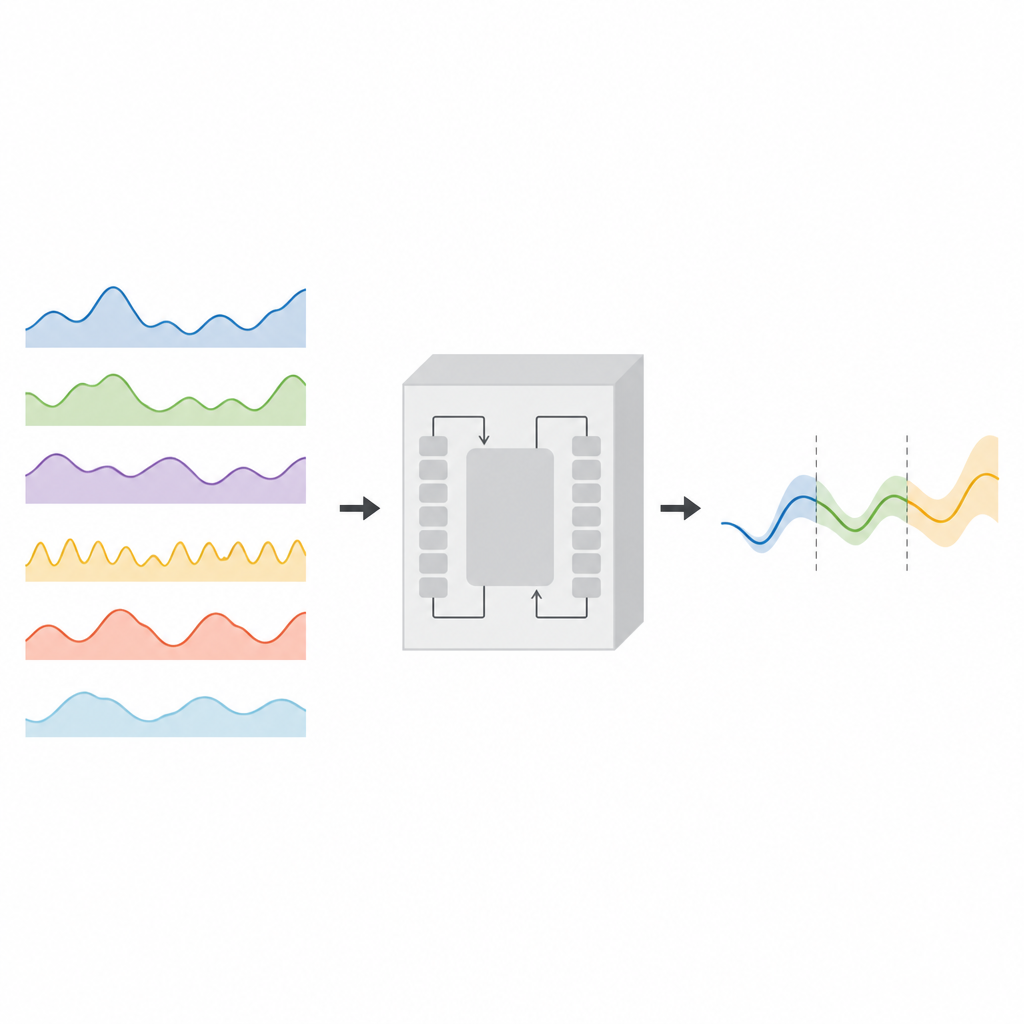
SHAPformer’s new short path to clear answers
SHAPformer redesigns the forecasting model itself so that explanations fall out naturally, without heavy sampling. It groups related inputs, such as all values from one day or all observations of a weather variable, and trains the Transformer to work even when some of these groups are deliberately hidden. Using a technique called attention manipulation, the model can cleanly switch feature groups on or off when generating a forecast. This makes it possible to compute exact SHAP-style contributions by evaluating all combinations of these groups directly, rather than approximating them from random samples. The result is a model that can explain a single forecast in less than a second, a speedup of roughly 50 to 1000 times compared with a widely used sampling-based SHAP method.
Checking explanations against a known truth
To test whether SHAPformer’s explanations are trustworthy, the authors first built a synthetic dataset where the rules that generate the data are fully known. They then used these rules to derive a “ground truth” for how much each input should matter and how exactly it should affect the forecast. SHAPformer’s explanations closely matched this ground truth, both in terms of overall importance and in detailed patterns, such as how holidays shrink demand or how weekends change daily curves. Competing methods either misjudged which features were most important or produced more noisy and inconsistent explanations.
What the model reveals about real energy data
Next, SHAPformer was applied to real-world data on electrical demand from a German transmission system operator and to day-ahead electricity prices in a European market zone. In the load case, the model confirmed that the single most influential input is the load from one week earlier, followed by the day of week and hour of day, with temperature, month, and holidays also playing clear but smaller roles. It captured intuitive patterns, such as lower loads on weekends, reduced activity around Christmas, and higher demand on cold days. For electricity prices, the model highlighted past prices and time-of-day patterns, but also showed how stronger wind and solar production tend to push prices down, in line with economic expectations.
Why these insights matter
SHAPformer demonstrates that it is possible to build forecasting models that are both strong performers and clear about their reasoning. Instead of treating explanations as an expensive add-on, the method bakes them into the design of the Transformer so that each prediction comes with a fast, faithful breakdown of which factors drove it. For decision makers in energy and other time-sensitive sectors, this means they can see not only what the model expects to happen, but also why, supporting better judgment, regulatory transparency, and more informed use of advanced AI tools.
Citation: Hertel, M., Pütz, S., Mikut, R. et al. Explainable time-series forecasting with sampling-free SHAP for Transformers. Nat Commun 17, 4723 (2026). https://doi.org/10.1038/s41467-026-73243-5
Keywords: time series forecasting, explainable AI, transformer models, electricity load, SHAP values