Clear Sky Science · en
Lifespan normative modeling of brain microstructure
Why brain wiring across life matters
Our brains are packed with bundles of microscopic “wires” that let distant regions talk to each other. These white matter pathways change from childhood through old age, and are often altered in conditions like dementia and schizophrenia. This study set out to build something like growth charts for these brain highways, so that doctors and researchers can see when an individual brain’s wiring looks typical for their age — and when it does not.
Building brain charts from a world of scans
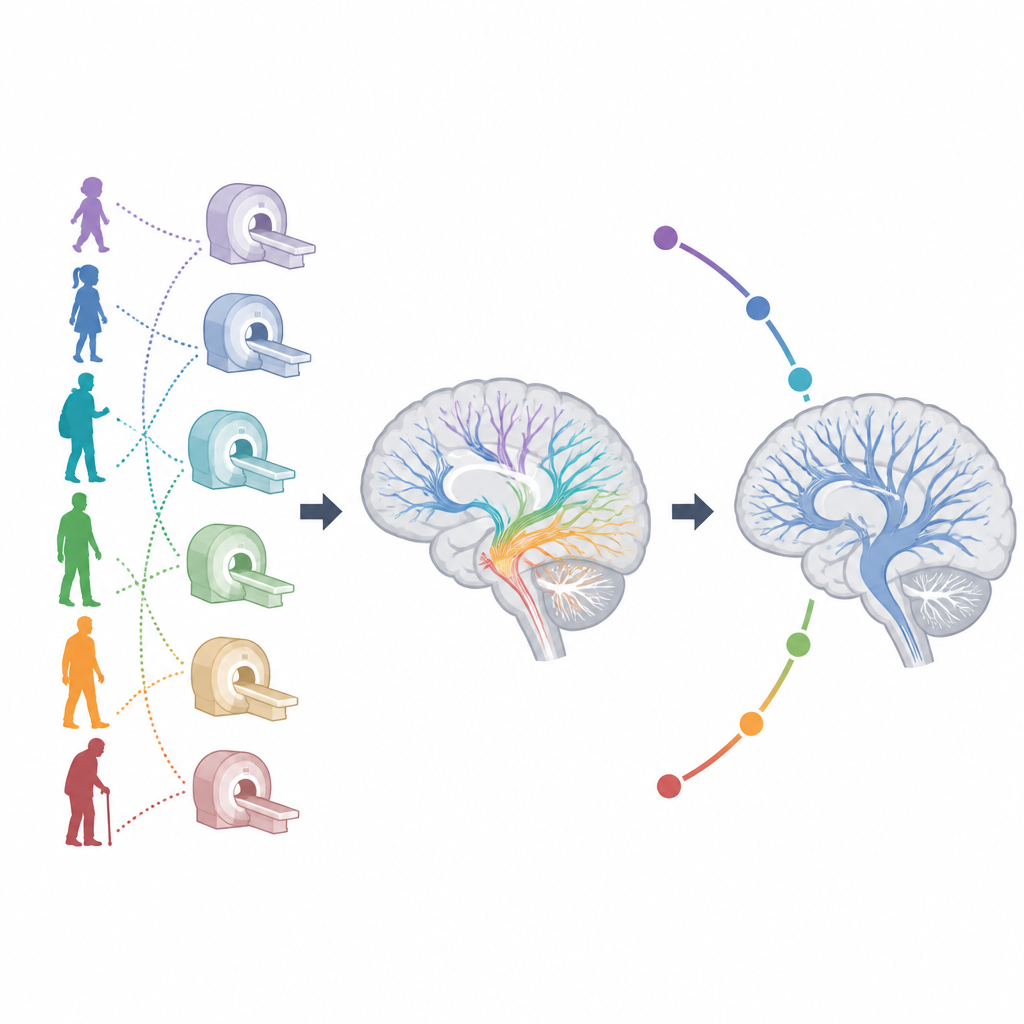
To make these charts, the researchers pooled diffusion MRI scans from 19 international projects, covering more than 54,000 people between 4 and 91 years old. Diffusion MRI tracks how water moves through brain tissue, which reveals how tightly packed and well insulated white matter fibers are. Using a common analysis and quality control pipeline, the team measured several standard indicators of white matter structure in 21 key regions and across the brain’s overall white matter.
From raw data to age based reference ranges
Different hospitals and research centers use different scanners and settings, which can shift the measurements. Instead of throwing away that diversity, the team used a statistical framework called hierarchical Bayesian regression to account for these site and scanner differences while modeling how white matter changes with age and sex. This allowed them to extract smooth lifespan curves and centile bands, much like height and weight charts used in pediatrics, describing how each white matter measure typically rises, peaks, and falls across life.
How brain wiring ages and what that reveals
The resulting charts showed a consistent picture. A measure that reflects how directionally water moves along fibers tended to increase through childhood and early adulthood, peaking around the late 20s to 30s before declining in later life. Measures linked to how freely water diffuses tended to show the opposite pattern, declining through youth and then increasing again in mid to late adulthood. The timing of these peaks and troughs varied by region and metric, suggesting that some pathways mature earlier and are more stable, while others take longer to develop and may be more vulnerable to age related decline.
Testing ideas about development and decline
The authors used these lifespan curves to test theories about “retrogenesis,” the notion that brain systems that develop last in childhood are the first to deteriorate in old age. They found support for a “last in, first out” pattern for several white matter measures: tracts that matured later tended to show faster decline in older age. In contrast, they did not find evidence for a related “gain predicts loss” idea, which suggests that faster early growth should be tied to faster later degeneration. Their results instead indicated that regions that change quickly early in life often reach maturity sooner and then decline more gently.
Spotting hidden problems in individual brains
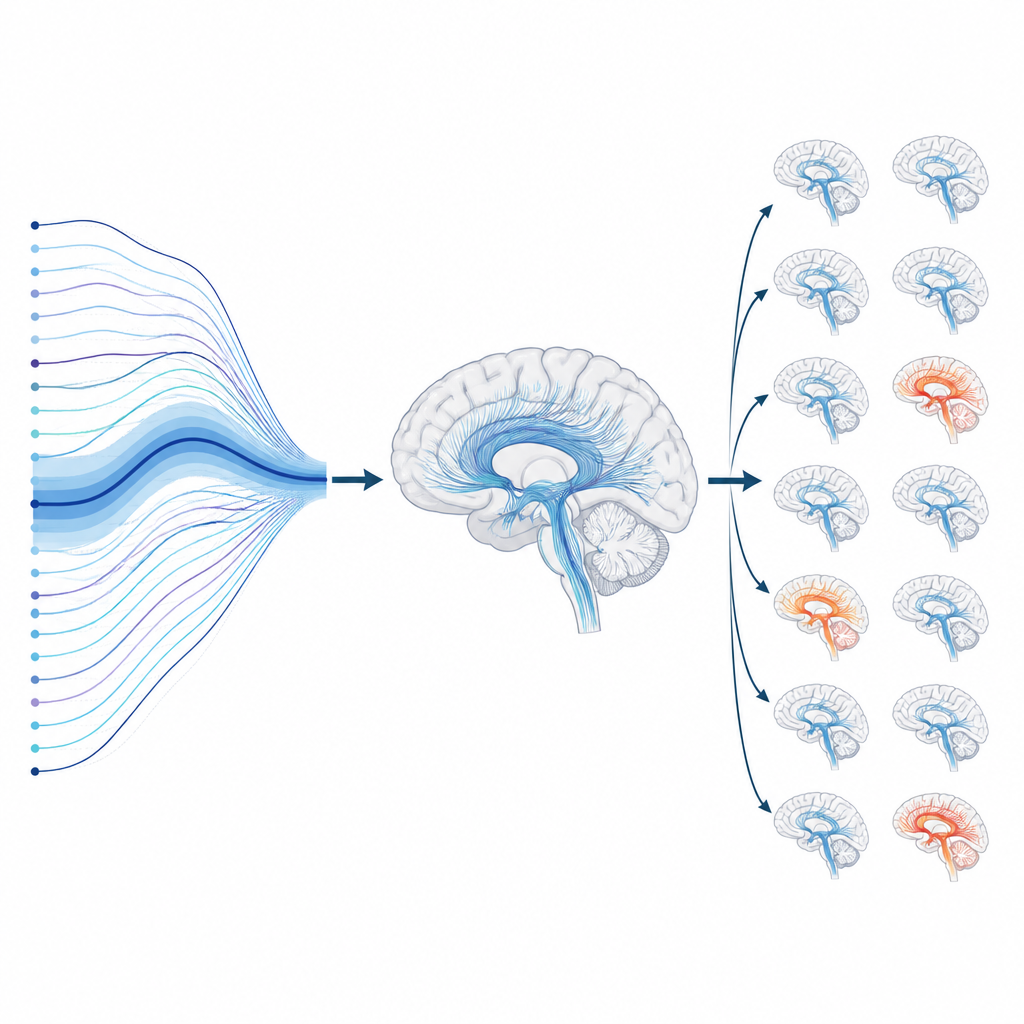
Beyond mapping typical change, the team showed how the charts can flag unusual patterns in single people. By comparing each person’s measurements to age and sex matched norms, they calculated deviation scores that highlight regions where white matter is unusually damaged or preserved. Applied to people with mild cognitive impairment, dementia, and a genetic deletion that raises schizophrenia risk, these scores revealed clusters of tracts with frequent extreme deviations, especially in pathways linked to memory and communication between brain hemispheres. They also showed how the model can be adapted to new clinics with relatively small numbers of local healthy volunteers.
What this work means for the future
For a layperson, the key message is that we now have large scale “vital signs” for the brain’s wiring, spanning most of the human lifespan. These reference charts make it easier to see when an individual’s white matter looks typical for their age, and when certain pathways may be unusually affected by disease or development. While not yet a routine clinical tool, this framework moves brain imaging toward more personalized assessments, where doctors can look beyond group averages to understand the unique pattern of brain changes in each person.
Citation: Villalón-Reina, J.E., Zhu, A.H., Nabulsi, L. et al. Lifespan normative modeling of brain microstructure. Nat Commun 17, 4693 (2026). https://doi.org/10.1038/s41467-026-72875-x
Keywords: brain white matter, diffusion MRI, lifespan brain development, dementia imaging, normative modeling