Clear Sky Science · en
Single-breath-hold 3D abdominal metabolic MRI enables label-free diagnosis of liver cancer
Why scanning the liver matters
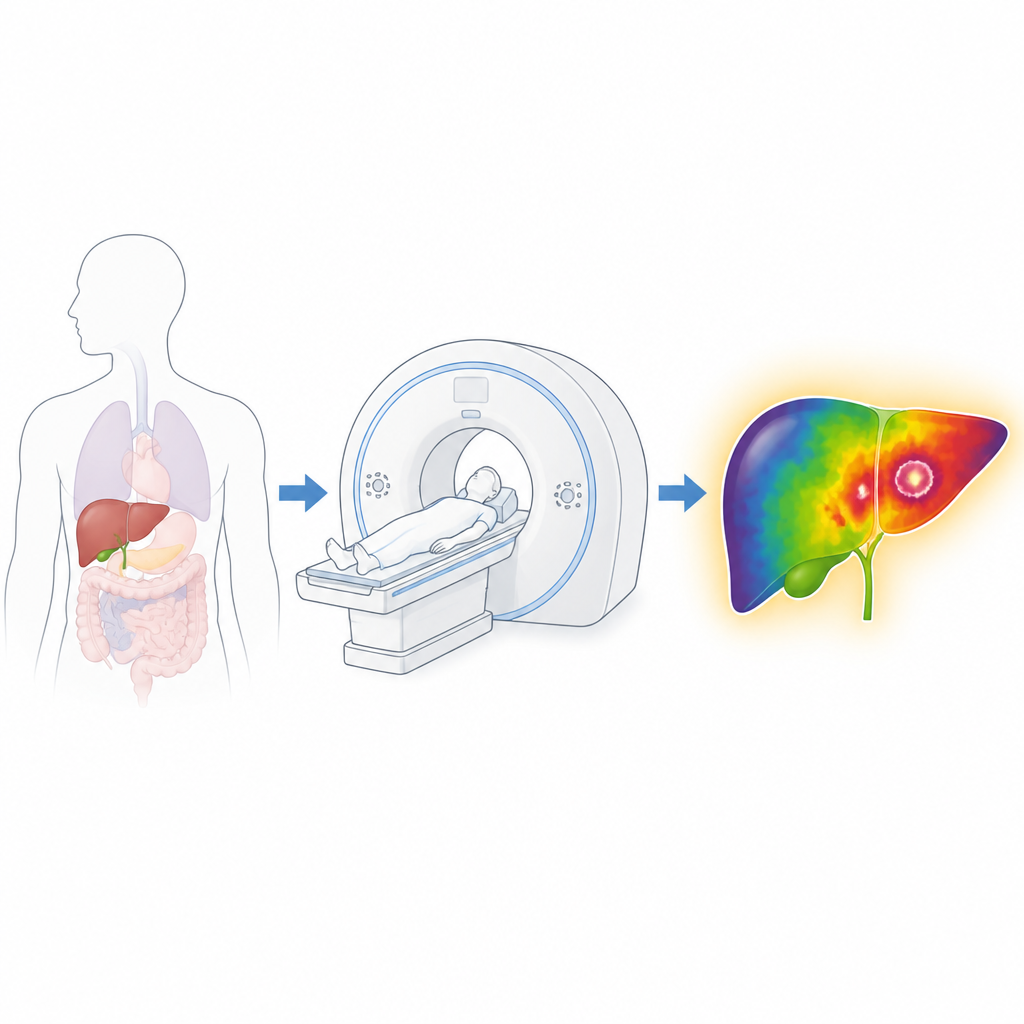
Liver disease affects hundreds of millions of people worldwide, yet doctors still struggle to see how this organ handles sugar, fats, and proteins in real time. This study introduces a new kind of MRI scan that can capture the liver’s chemistry in just one breath-hold, without any injected dyes or radioactive tracers. It offers a quick, comfortable way to tell active liver tumors from dead tissue left after treatment and to watch how the liver responds to fasting and sugar intake.
A new way to see chemistry inside the body
Standard MRI excels at showing organ structure, but it says little about how those organs are working at the molecular level. A newer method called CEST MRI can pick up signals from natural molecules like proteins, glycogen, and glucose by nudging their hydrogen atoms and watching how they exchange with water. Until now, applying CEST to the abdomen has been impractical because it needs many repeated scans that take more than five minutes and are easily blurred by breathing motion. The authors tackle this by redesigning how the scan gathers and reconstructs data so that a full 3D map of liver chemistry can be obtained during a single breath-hold of about 20 seconds.
Turning motion into a helpful signal
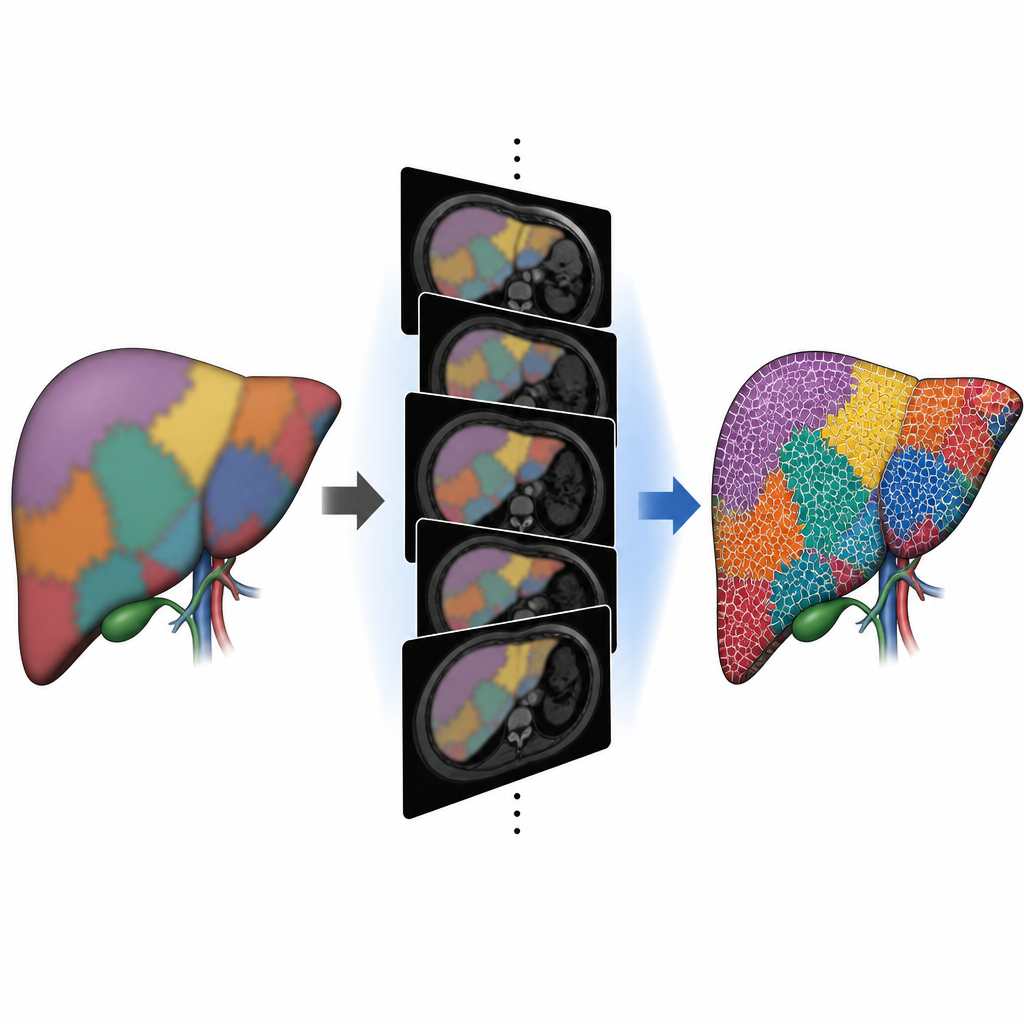
The heart of the new approach, called spatial spectral encoding, is a clever trick in both hardware use and software reconstruction. During the labeling step of CEST MRI, the system applies a gentle magnetic gradient along the body, so that different slices of the liver are tuned to slightly different chemical frequencies at the same time. Each rapid scan therefore traces a diagonal path through a grid that represents position versus chemical signal. By repeating this step only 10 or 11 times with carefully chosen settings, the scanner lightly samples many parts of that grid instead of fully covering it the slow, traditional way. Afterward, a data-driven algorithm groups nearby image pixels and uses their shared spectral features to mathematically “fill in” the missing frequencies, yielding dense chemical spectra for every tiny volume in the liver.
Putting the method to the test
The team first checked accuracy using test tubes containing known amounts of glycogen and an ex vivo pig liver. Across several sampling patterns, the new scan reproduced conventional CEST results while cutting scan time from nearly 12 minutes to a few minutes. Next, they implemented a single breath-hold protocol in healthy volunteers, capturing 3D images of the liver and nearby organs at more than a hundred frequency points. Repeated scans in the same people showed highly consistent contrast maps, and the images were sharp enough to reveal small structures such as the pancreas and spleen. Because the spectra are fully resolved, the method supports richer analysis tools that separate overlapping signals and correct for field inhomogeneities.
Watching real metabolic changes in real people
To show that the scan reflects genuine biology, the researchers studied volunteers before and after overnight fasting and during an oral glucose tolerance test. After fasting, signals linked to mobile proteins and glycogen dropped by roughly one third across the liver and other abdominal organs, matching expectations that stored fuel is being used. During the glucose test, the team repeatedly scanned the liver for almost an hour after subjects drank a sugar solution. They observed a rise in a specific glucose-related signal that peaked around 30 minutes and remained elevated, while standard T2 relaxation changes were small and variable. These experiments demonstrate that the new method can track dynamic shifts in metabolism over time without injections.
Distinguishing active tumors from scar tissue
The most clinically striking results came from patients with hepatocellular carcinoma, a common form of liver cancer. Using the new scan at two saturation settings, the authors created maps emphasizing proteins, glycogen-related signals, and other macromolecules. Active tumors consistently appeared brighter than the surrounding liver and much brighter than necrotic regions left after treatment, while benign cysts often remained less visible. Quantitative analysis confirmed that several of these contrasts were significantly higher in active tumors, whereas a more traditional asymmetry measure at higher power sometimes failed to separate them. In one patient, areas that lit up strongly on the new MRI matched hot spots on FDG PET scans, hinting that this label free method can approximate some of the metabolic insight of PET without radiation.
What this means for patients
By combining rapid scanning and advanced reconstruction, this single breath hold 3D metabolic MRI turns the liver into a colorful map of its own chemistry. It allows clinicians to visualize how sugars and proteins are handled across the entire organ, distinguish active cancer from dead tissue, and monitor how metabolism changes with diet or treatment, all without contrast injections or radioactive tracers. While the technique still needs further refinement and broader testing, it points toward a future in which a brief, comfortable MRI exam can provide both structural and metabolic information to guide care for liver and other abdominal diseases.
Citation: Liu, C., Gao, N., Ren, H. et al. Single-breath-hold 3D abdominal metabolic MRI enables label-free diagnosis of liver cancer. Nat Commun 17, 4661 (2026). https://doi.org/10.1038/s41467-026-71124-5
Keywords: liver cancer, metabolic MRI, CEST imaging, hepatocellular carcinoma, glucose metabolism