Clear Sky Science · en
Mapping global avian influenza risk patterns through waterbird activity entropy
Why bird movement matters for flu
Avian influenza, or “bird flu,” is not just a problem for wild birds. It can spill over into chickens, cattle, and eventually people, as recent outbreaks have shown. Yet tracking where and when this risk is highest across the globe has been difficult. This study introduces a new way to use bird migration patterns to map where dangerous contacts between wild waterbirds, farm animals, and humans are most likely to occur. It turns massive bird observation datasets into a single map that highlights global hotspots where a new outbreak could emerge.
Following birds around the world
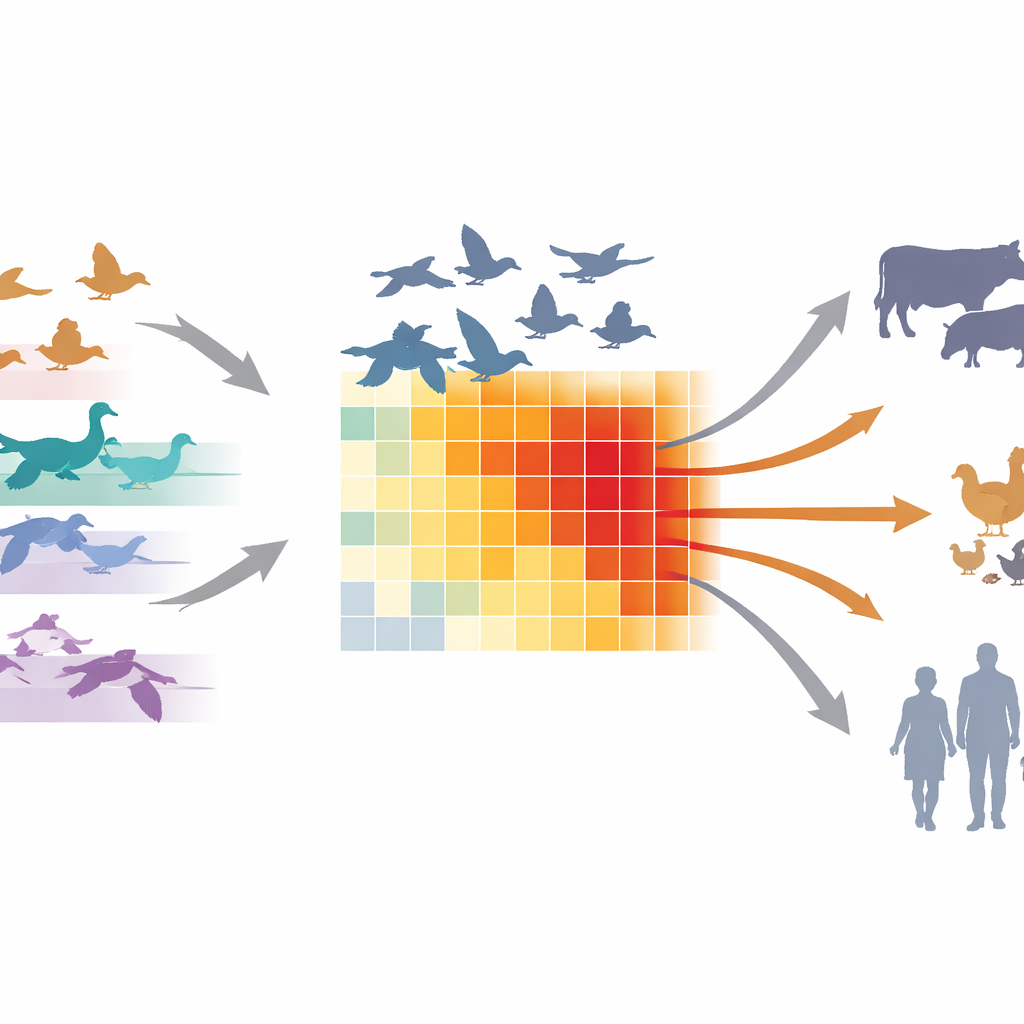
The researchers focused on waterbirds—ducks, geese, swans, shorebirds, seabirds, and large wading birds—because these species are the main natural carriers of avian influenza viruses. Using millions of citizen-science records from platforms like GBIF, they modeled the monthly ranges of 779 waterbird species worldwide. Instead of just asking where birds occur, they also captured when they are present, following their seasonal movements between breeding, stopover, and wintering sites. This high‑resolution view of bird presence over the year lays the groundwork for understanding when and where different species overlap, and how that overlap could fuel virus spread.
A simple measure of busy bird places
To turn complex bird movements into an intuitive risk indicator, the team developed “waterbird activity entropy” (WAE). In plain terms, WAE scores how intense and sustained waterbird activity is in each half‑degree grid cell on Earth. It combines how many species use a place, and for how many months of the year they stay there. Areas where many species linger for long periods receive high WAE values, signaling busy “meeting points” where viruses can mix and jump between bird species. When the scientists compared WAE with two decades of avian influenza detections—after filtering out outbreaks that only spread among poultry—they found that high‑WAE areas captured more than 80% of recorded cases, with strong predictive performance for highly pathogenic H5N1.
Where birds, farms, and people collide
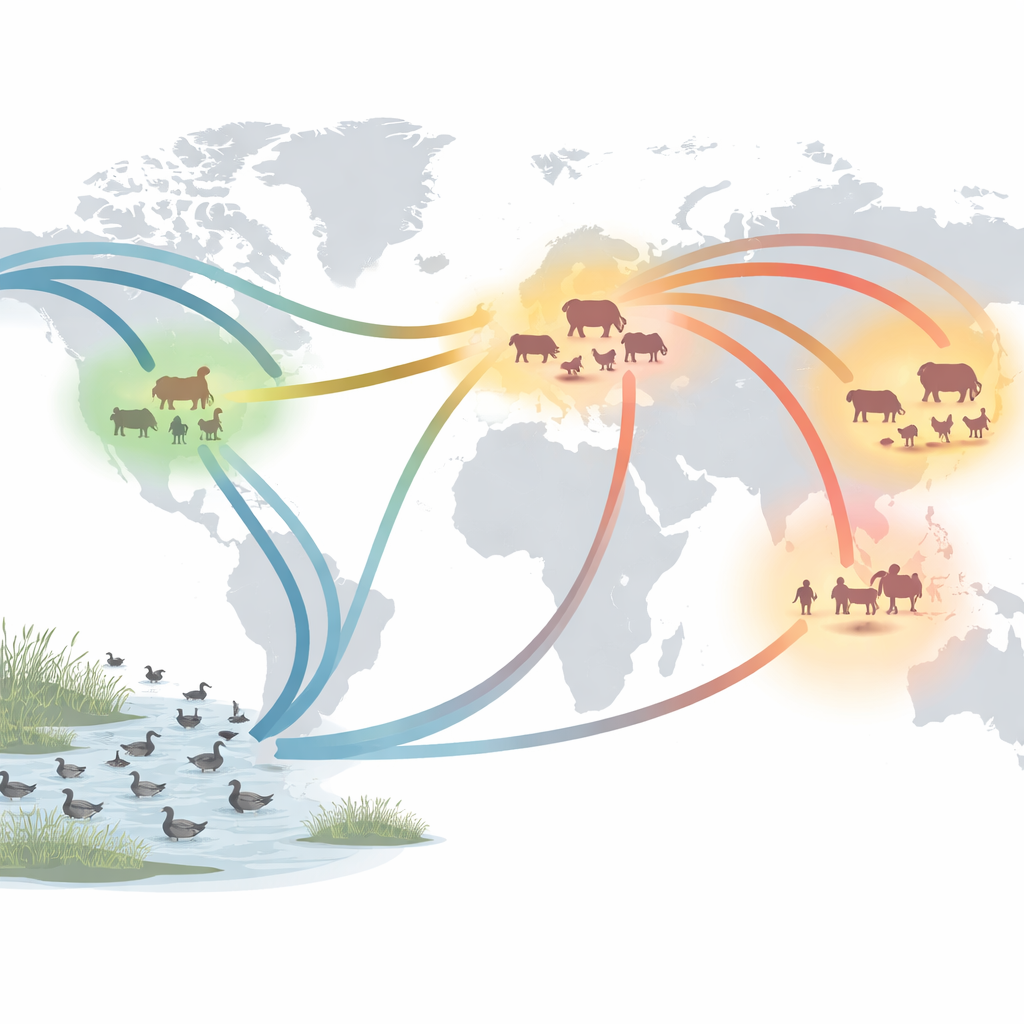
Bird activity alone does not cause outbreaks; risk climbs where wild birds interact with dense human and livestock populations. The authors therefore overlaid WAE with global maps of people, cattle, and poultry. This revealed a network of exposure hotspots covering about 14% of the world’s land, but containing over half of the people and poultry, and more than a third of cattle, that are potentially exposed to waterbird‑carried viruses. Four regions stand out: the United States, the European Union, China, and India together hold nearly half of the global hotspot area and 44% of reported avian influenza cases. In these places, key interfaces differ—poultry and humans in southeastern China, cattle and humans in parts of India and Africa, and cattle‑heavy dairy regions in the United States currently facing H5N1 in cows.
Which birds deserve extra attention
The study also asks which kinds of waterbirds are most closely linked to people, cattle, and poultry in these hotspot countries. By grouping species into functional types—waterfowl, seabirds, shorebirds, large wading birds, and others—the authors show that waterfowl and seabirds are especially important. Waterfowl activity is strongly correlated with human, cattle, and poultry densities in the USA and China, reflecting shared wetlands and free‑range farming systems. Seabirds, often concentrated along coasts and near cities, also show strong overlap with people and poultry in Europe and China. Large wading birds that forage near cattle, such as egrets, may be especially relevant in African and South Asian landscapes. These patterns suggest that targeted surveillance of specific bird groups in particular regions could greatly improve early warning.
Hidden risks and shared responsibility
A striking finding is that some of the biggest exposure hotspots lie in regions with very few recorded cases, especially in sub‑Saharan Africa. Countries such as Tanzania, Ethiopia, and Zambia contain vast high‑WAE areas with many cattle and people but almost no reported avian influenza, likely because surveillance resources are limited. The authors argue that their framework can help direct monitoring to these “silent” hotspots before dangerous strains spread unnoticed. Overall, by coupling bird movement, residency, and host density into a single map, the study offers a practical tool for anticipating where the next avian influenza threat is most likely to emerge and highlights the shared global responsibility—especially for major hotspot nations—to invest in smarter, more equitable surveillance.
Citation: Li, Y., Qiao, Y., Zhan, Y. et al. Mapping global avian influenza risk patterns through waterbird activity entropy. Nat Commun 17, 3606 (2026). https://doi.org/10.1038/s41467-026-70432-0
Keywords: avian influenza, waterbirds, disease hotspots, zoonotic spillover, global surveillance