Clear Sky Science · en
Joint control of precipitation and CO2 on global long-term patterns of plant nitrogen availability
Why the planet’s nitrogen story matters
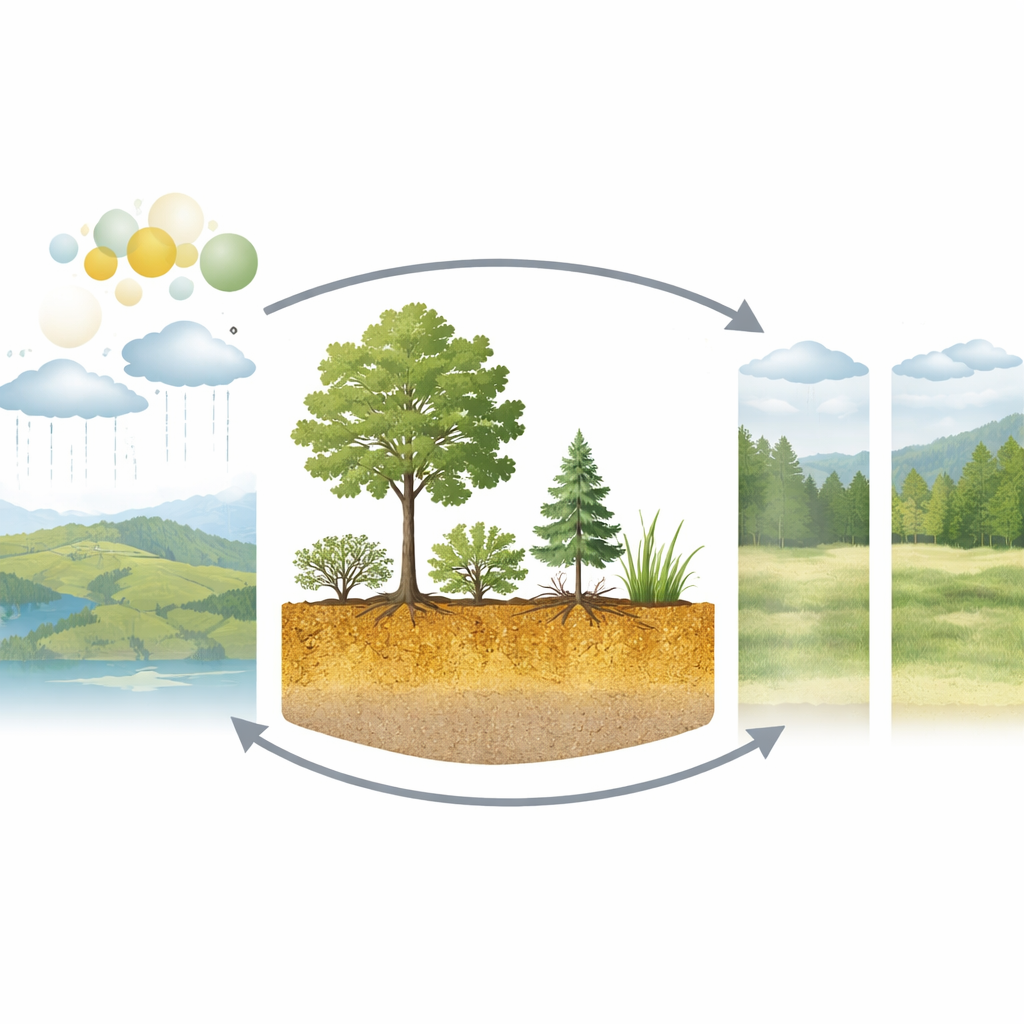
Plants need nitrogen as much as they need sunlight and water. It is a key ingredient for building leaves, wood, and the machinery of photosynthesis that draws carbon dioxide (CO2) out of the air. If plants do not get enough nitrogen, their growth – and the land’s ability to slow climate change by locking away carbon – can stall. This study asks a deceptively simple question with big consequences: as CO2 and climate have changed over the last four decades, has nitrogen become harder or easier for plants to obtain across the globe?
Reading nitrogen’s fingerprint in leaves
Directly measuring how much usable nitrogen plants have in every forest, grassland, and shrubland on Earth is impossible. Instead, the researchers turned to a subtle chemical clue: the ratio of different nitrogen isotopes (called foliar δ15N) in leaves. Higher values of this ratio generally signal that plants enjoy more generous nitrogen supplies relative to their demand. Lower values hint at tighter, more “stingy” nitrogen conditions. The team assembled a vast collection of 37,268 leaf measurements from past field studies on all continents and paired them with detailed climate and pollution records from 1980 to 2020.
Teaching computers to map a hidden resource
Because these leaf measurements are scattered unevenly in space and time, simple averages can be misleading. To fill the gaps, the authors trained four advanced machine-learning models to predict foliar δ15N using 24 environmental variables, including temperature, rainfall, atmospheric CO2, and nitrogen deposition from air pollution. They also accounted for the types of underground fungal partners – mycorrhizae – that help plants acquire nitrogen, since different partnerships tend to show distinct isotope signatures. By combining model predictions and information on how common each mycorrhizal type is in each region, they built yearly global maps of plant nitrogen availability at half-degree resolution from 1980 to 2020.
Where nitrogen is plentiful and where it is scarce
The resulting maps show strong and systematic differences across the planet. Warmer, low-latitude regions such as tropical and subtropical forests have higher foliar δ15N, consistent with more open and active nitrogen cycling, where nitrogen moves quickly through soils and is often lost as gases or in runoff. Cooler, high-latitude forests and some shrublands tend to have lower δ15N, indicating tighter nitrogen economies. Among vegetation types, evergreen broadleaf forests and dense shrublands stand out with relatively high isotope values, while needleleaf forests and mixed forests often appear more nitrogen-limited. Statistical analysis revealed that, on the spatial dimension, mean annual temperature is by far the dominant factor shaping these global patterns, dwarfing the roles of CO2, rainfall, and nitrogen deposition.
How the nitrogen landscape has changed over time
Looking through time, the story is more nuanced than a simple, steady decline. Across much of the world, foliar δ15N did drop between 1980 and 1988, suggesting that plant-available nitrogen became scarcer during that decade. After this initial fall, however, the global average largely leveled off, with big regions showing little further change from 1989 onward and some even showing slight increases. The study also shows that not all ecosystems behaved alike. Grasslands, savannas, and closed shrublands experienced stronger long-term declines, implying growing nitrogen stress, while many needleleaf forests and woody savannas showed weaker or more stabilizing trends, meaning earlier worries about ever-worsening nitrogen shortages in these systems may have been overstated.
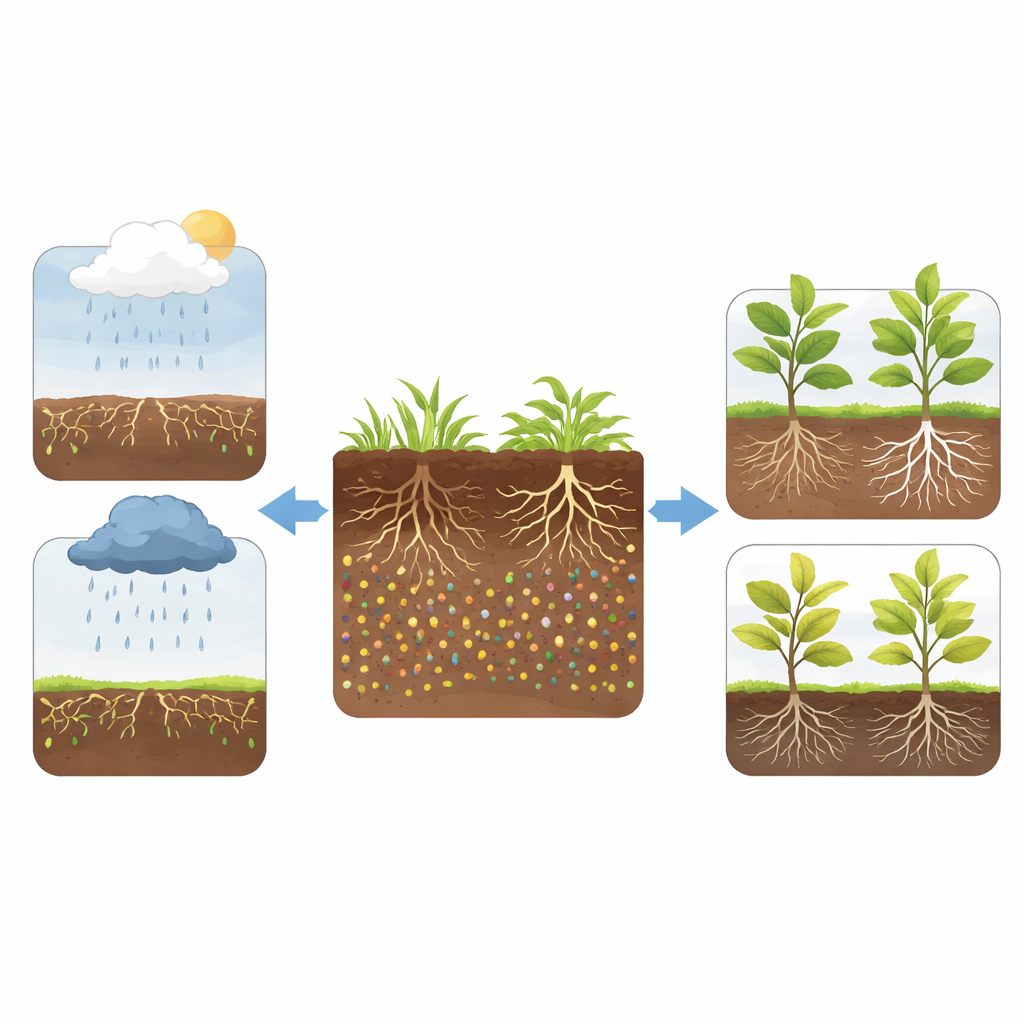
When CO2 leads and when rain takes over
The authors next asked which forces best explain these shifts over time. Early in the record, from 1980 to 1988, rising atmospheric CO2 appears to be the main driver of changes in foliar δ15N over a large share of the world’s land, especially in mid- and high-latitude forests and shrublands. Higher CO2 tends to stimulate plant growth and nitrogen demand, which can make nitrogen feel relatively more scarce. After 1989, the picture changes: variations in rainfall become the leading influence over a wider area, particularly in shrublands and grasslands. In these regions, wetter or drier conditions strongly shape how nitrogen moves through soils and how much plants can take up, while the direct imprint of nitrogen falling from the atmosphere plays a relatively minor role overall.
What this means for climate and future ecosystems
Taken together, this work offers a clearer, globally consistent view of how plant nitrogen availability has evolved during a period of rapid environmental change. It confirms that many ecosystems did experience a notable tightening of nitrogen supply in the 1980s, but it also shows that this trend did not continue unchecked. Instead, the main controls have shifted over time: CO2-driven changes dominated early on, while rainfall patterns now play an increasingly important role in shaping how much nitrogen plants can access. For a lay reader, the key takeaway is that the world’s green cover is not just limited by how much CO2 is in the air, but also by how water and nutrients flow through soils. As climate change alters rainfall patterns, understanding this joint control of water and nitrogen will be crucial for predicting how strongly land ecosystems can continue to absorb carbon in the decades ahead.
Citation: Tang, S., Qiao, Y., Xia, J. et al. Joint control of precipitation and CO2 on global long-term patterns of plant nitrogen availability. Nat Commun 17, 3952 (2026). https://doi.org/10.1038/s41467-026-70358-7
Keywords: plant nitrogen availability, climate change, precipitation, carbon cycle, stable isotopes