Clear Sky Science · en
Electric double layer structure in concentrated aqueous solution
Why the Hidden World at Electrodes Matters
Whenever a battery charges, hydrogen is made from water, or carbon dioxide is turned into useful fuels, the crucial action happens in a paper-thin zone where a solid electrode meets a liquid. In this narrow region, known as the electric double layer, water molecules and dissolved salts quietly rearrange themselves and control how efficiently electricity becomes chemistry. Yet, despite its importance for clean energy technologies, the fine structure of this interfacial layer—especially in realistically salty solutions—has remained surprisingly mysterious. This study uses advanced computer simulations and sensitive experiments to reveal how this hidden world is organized and why its structure changes as we vary salt concentration and applied voltage.
A Thin Layer that Runs Electrochemistry
The electric double layer forms because a charged electrode attracts oppositely charged ions from the surrounding liquid while pushing away like charges. Together with the orientation of nearby water molecules, this creates a structured zone only a few billionths of a meter thick. The way charge builds up in this region can be measured as a capacitance—a quantity that, when plotted against voltage, often shows a curious “camel” shape with two peaks at low salt concentration. As the solution becomes more concentrated, experiments show that these two peaks merge into a single “bell” peak, but the molecular reasons for this change have been unclear. Traditional theories treat the liquid as a smeared-out charge distribution and cannot capture the detailed positions and motions of individual water molecules and ions.
Using Atomic Simulations as a Microscope
To look directly inside the double layer, the authors used an all-atom simulation approach that combines quantum mechanics for the silver electrode with classical molecular dynamics for thousands of water molecules and dissolved ions. They also developed a new “Chemostat” method that keeps the bulk salt concentration realistic and stable during the simulation. This allowed them to mimic experimental conditions at different concentrations while scanning the electrode voltage. From these simulations, they extracted how much charge sits on the electrode at each voltage, and hence the capacitance. Remarkably, the calculated peak positions agree with lab measurements to within about a tenth of a volt and reproduce the full transition from camel-shaped to bell-shaped curves.
Water Flips and Ions Crowd: Two Types of Transitions
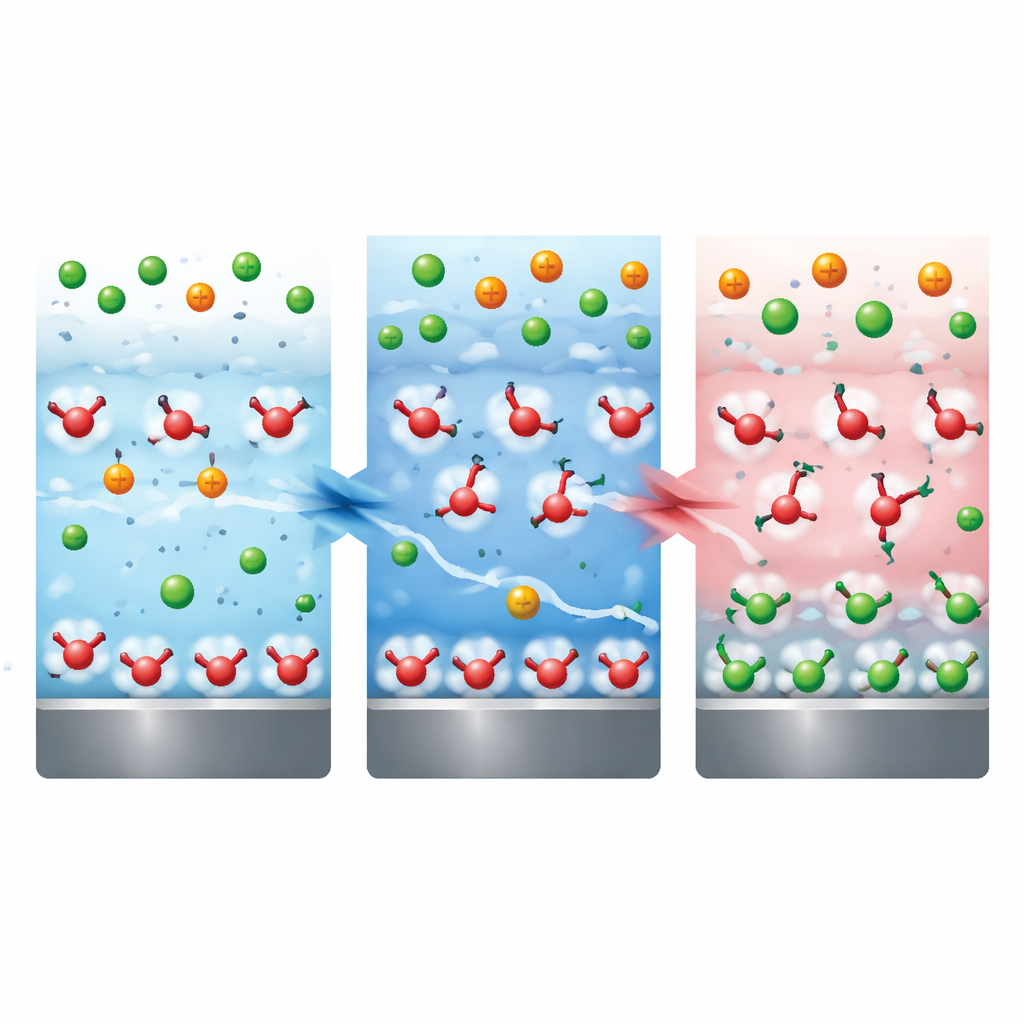
The simulations reveal that the two capacitance peaks arise from distinct structural phase transitions within the double layer. On the negative side of the voltage scale, the key actors are water molecules right next to the metal. At moderate voltages, these molecules can adopt several orientations, but as the electrode becomes more negatively charged they collectively flip into a configuration where one hydrogen points toward the surface. This sharp, cooperative reorientation acts like a phase change in two dimensions and produces one of the capacitance peaks. Because this process is largely governed by the strong electric field right at the surface and by the water layer itself, it barely depends on how salty the bulk solution is.
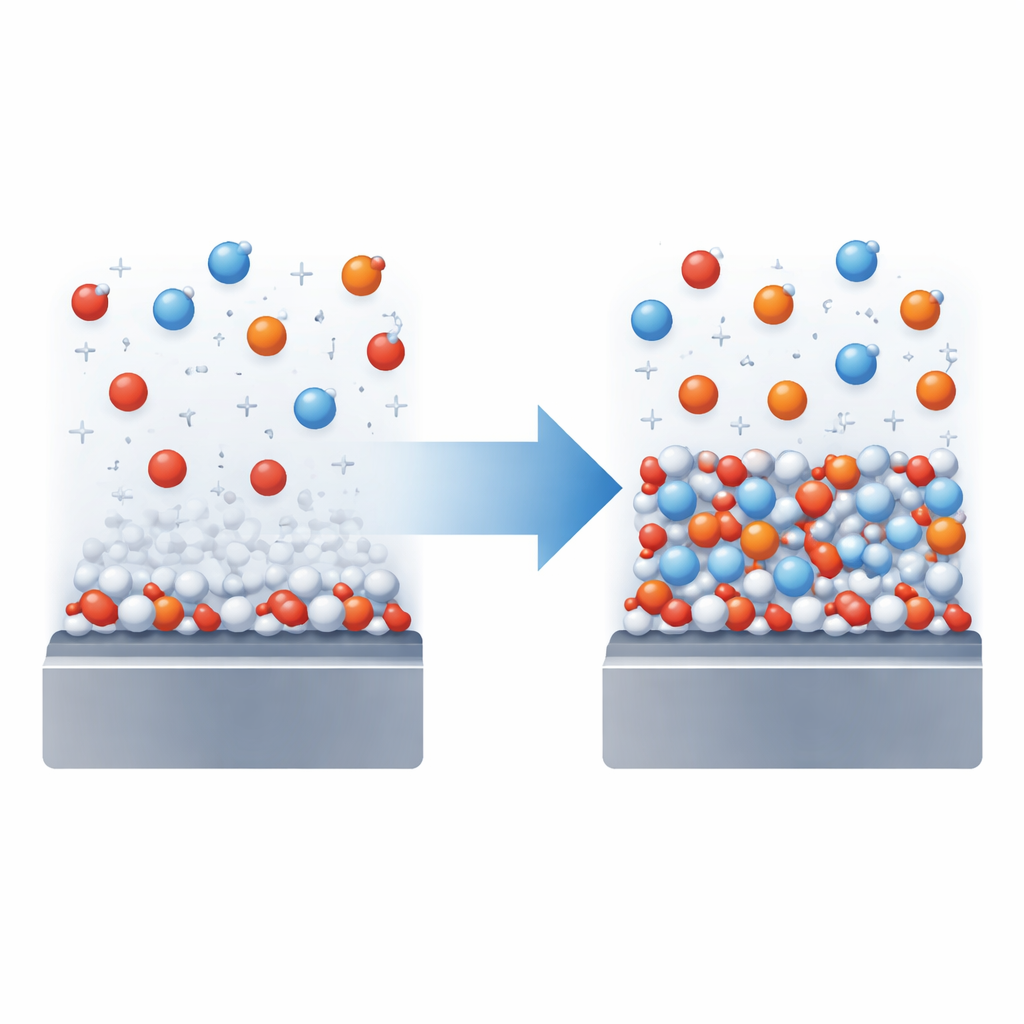
On the positive side, the story centers on negatively charged ions. As the electrode becomes more positively charged, these anions move in, partially shed their surrounding water shell, and pack into a dense, almost crystal-like layer directly on the metal. Water molecules act as tiny bridges between neighboring ions, helping them overcome their natural repulsion and condense into this crowded layer. This transition from a gas-like spread of ions to a condensed surface film is highly sensitive to overall salt concentration: in more concentrated solutions, the entropy penalty for ordering the ions is smaller, so the transition happens at lower voltages and more abruptly. This gives rise to the second capacitance peak, which shifts and strengthens with increasing concentration.
A Map of Interfacial Phases
By combining their simulation-based models across a range of concentrations, the researchers built a phase diagram that maps out which structural state the double layer adopts at each voltage and salt level. At low concentrations, sweeping the voltage from negative to positive makes the system cross two phase boundaries: first a water-orientation transition, then an anion-condensation transition—hence the camel-shaped capacitance curve. Above a certain concentration, both transitions effectively merge into one, corresponding to the single bell-shaped peak seen in experiments. Infrared measurements of water vibrations at the silver surface, performed in situ, confirm the predicted changes in water orientation and anion coordination as the voltage is varied.
What This Means for Better Electrochemical Devices
In everyday language, this work shows that the ultrathin liquid layer at an electrode behaves more like a collection of distinct phases—flipped water, mixed water, and packed ions—than like a simple smooth charge cloud. As we tune voltage and salt concentration, the system undergoes abrupt reorganizations that strongly affect how much charge it can store and how it steers chemical reactions. By explaining a long-standing puzzle in capacitance measurements and linking it to clear molecular pictures, the study provides a roadmap for deliberately shaping the interfacial environment. Such control could help engineers design more efficient catalysts for carbon dioxide reduction, hydrogen production, and other key reactions at the heart of future energy and chemical technologies.
Citation: Kim, M.M., Kim, D.H., Cho, J. et al. Electric double layer structure in concentrated aqueous solution. Nat Commun 17, 3645 (2026). https://doi.org/10.1038/s41467-026-70322-5
Keywords: electric double layer, electrode interfaces, water structure, ion adsorption, electrocatalysis