Clear Sky Science · en
Unveiling individual and collective temporal patterns in the tanker shipping network
Why ship movements matter to all of us
Most of the fuel that powers cars, planes, and factories around the world travels by sea on giant oil tankers. Yet the paths these ships take are usually studied as if they were frozen in time, ignoring how routes change from week to week and season to season. This paper peels back that static view, showing how the timing and sequencing of tanker movements affect both profits and pollution—and how the global network of ships pulses with regular yearly rhythms that mirror our energy use.
Following ships through time, not just on a map
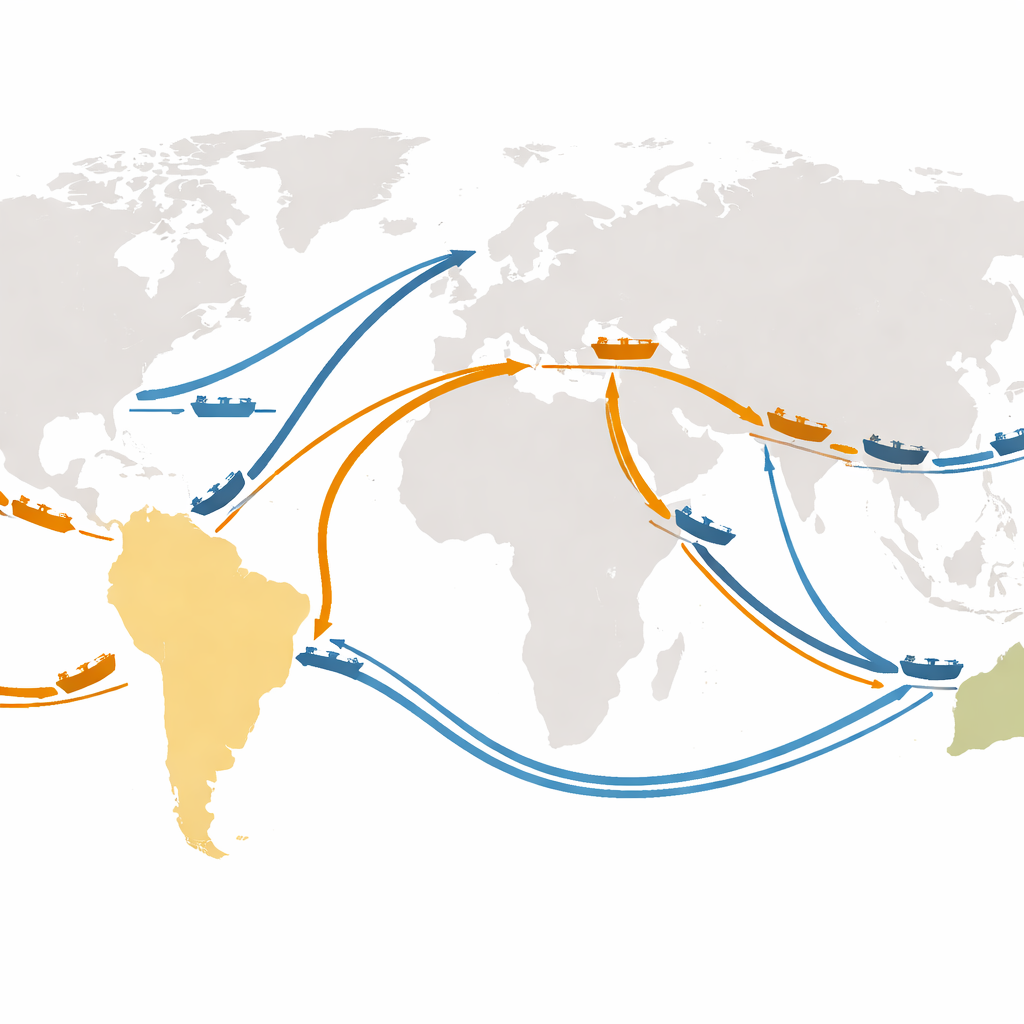
Traditional studies of shipping treat the global fleet as a set of fixed links between ports, like a subway map. That works reasonably well for container ships, which run on schedules along fairly stable routes. Oil tankers, however, work more like freelance trucks: each vessel competes for individual cargoes, constantly changing course as prices and opportunities shift. The authors argue that when we flatten this restless behavior into a single static network, we lose crucial information about when and in what order ships visit different regions. To restore that missing dimension, they analyze several years of detailed voyage data for more than 3,000 medium to very large tankers, grouping over a thousand ports into 26 trading regions to focus on broad patterns rather than individual harbors.
Measuring how much time ships do useful work
To judge how well ships are being used, the researchers introduce a simple but powerful measure: the laden–ballast ratio. A ship is “laden” when it is carrying oil and earning revenue; it is in “ballast” when sailing empty to its next loading port. By calculating the share of each vessel’s at-sea time spent laden rather than in ballast, the team can compare routing performance without knowing sensitive details such as fuel consumption or engine type. Across all four tanker size classes, they find large differences between the best and worst performers. Ships in the top quarter of each class spend roughly 50 percent more of their at-sea time carrying cargo than those in the bottom quarter—a gap that translates directly into higher earnings and lower emissions per ton of oil moved.
Hidden patterns in how ships hop between regions
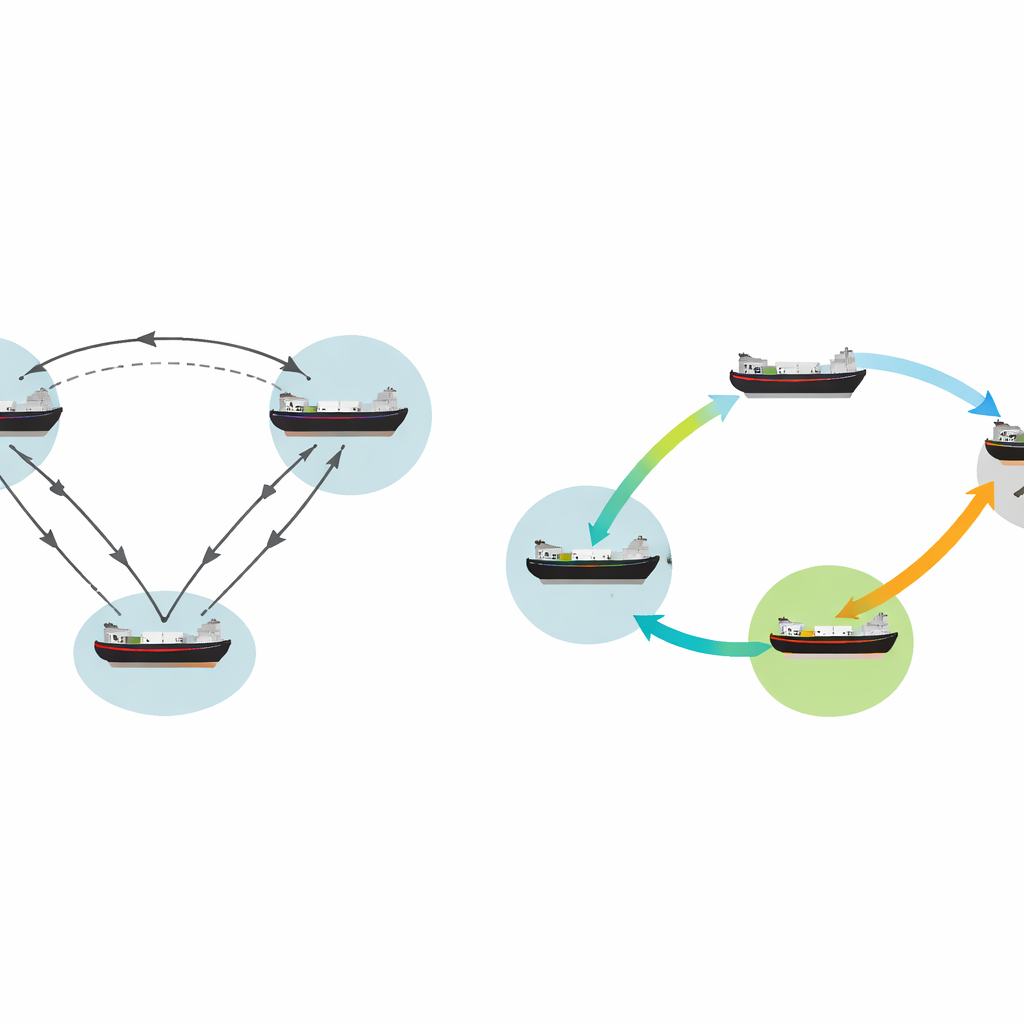
Beneath these performance differences lie distinct “movement signatures” in how ships string their voyages together. The authors break each ship’s regional path into short, three-step sequences—like visiting region A, then B, then C—and classify these into a handful of simple motifs. Some motifs reflect staying within a single region; others represent shuttling back and forth between two regions; one especially diverse motif captures visits to three different regions in a row. When they compare high- and low-performing ships, a clear picture emerges. Efficient vessels, regardless of size, show more of the three-region exploration motif and fewer of the stay-in-one-region motifs. In other words, the ships that do best spend more time circulating among multiple markets and less time repeating the same local patterns. They also use short, nearby moves when sailing empty to quickly reach the next cargo, then accept longer hauls when actually carrying oil.
The seasonal heartbeat of global oil flows
Zooming out from individual ships to the entire network, the study examines how total cargo flows into and out of each region rise and fall over time. Using a mathematical technique called Dynamic Mode Decomposition, the authors extract the main repeating cycles in these noisy time series. A dominant yearly rhythm emerges: on average, regional tanker flows swing by about 16 percent between peak and trough over a roughly 51-week cycle. Large import regions in the northern hemisphere, especially China and parts of Europe, tend to peak around late winter, reflecting higher fuel demand. Export regions such as the Middle East and parts of South America often peak roughly half a year out of phase, supplying those consumption surges. Different ship sizes plug into this seasonal pattern in distinct ways—very large crude carriers mostly serve a few key long-haul routes, while smaller tankers spread seasonal activity across more regions.
What this means for trade, profits, and the planet
Taken together, the findings show that how ships move in time—not just where they go—has real economic and environmental consequences. Ships that diversify their routes across regions and minimize empty sailing time make better use of fuel, reduce emissions per unit of cargo, and are better positioned to chase price differences across the globe. At the same time, the clear annual cycles in regional flows give ports, regulators, and shipowners a kind of seasonal forecast for when pressure on infrastructure, fuel use, and emissions will be highest. By revealing these individual and collective temporal patterns, the study offers a toolkit for optimizing tanker operations in ways that can boost profits while also cutting the climate cost of moving the world’s oil.
Citation: Teo, K., Arnold, N., Hone, A. et al. Unveiling individual and collective temporal patterns in the tanker shipping network. Nat Commun 17, 3300 (2026). https://doi.org/10.1038/s41467-026-70013-1
Keywords: tanker shipping, maritime trade, shipping efficiency, seasonal oil flows, network dynamics