Clear Sky Science · en
Satellite mapping of every building’s function in urban China reveals deep built environment disparities
Why city buildings matter to everyday life
From the street, a city looks like a jumble of towers, homes, schools, and shops. Yet the exact mix and placement of these buildings quietly shape how long your commute takes, how quickly you can reach a doctor, and how crowded your local park feels. This study uses satellites to look at every building across major cities in China, revealing where people enjoy well‑served neighborhoods and where residents face hidden shortages in basic urban comforts.
Seeing cities building by building
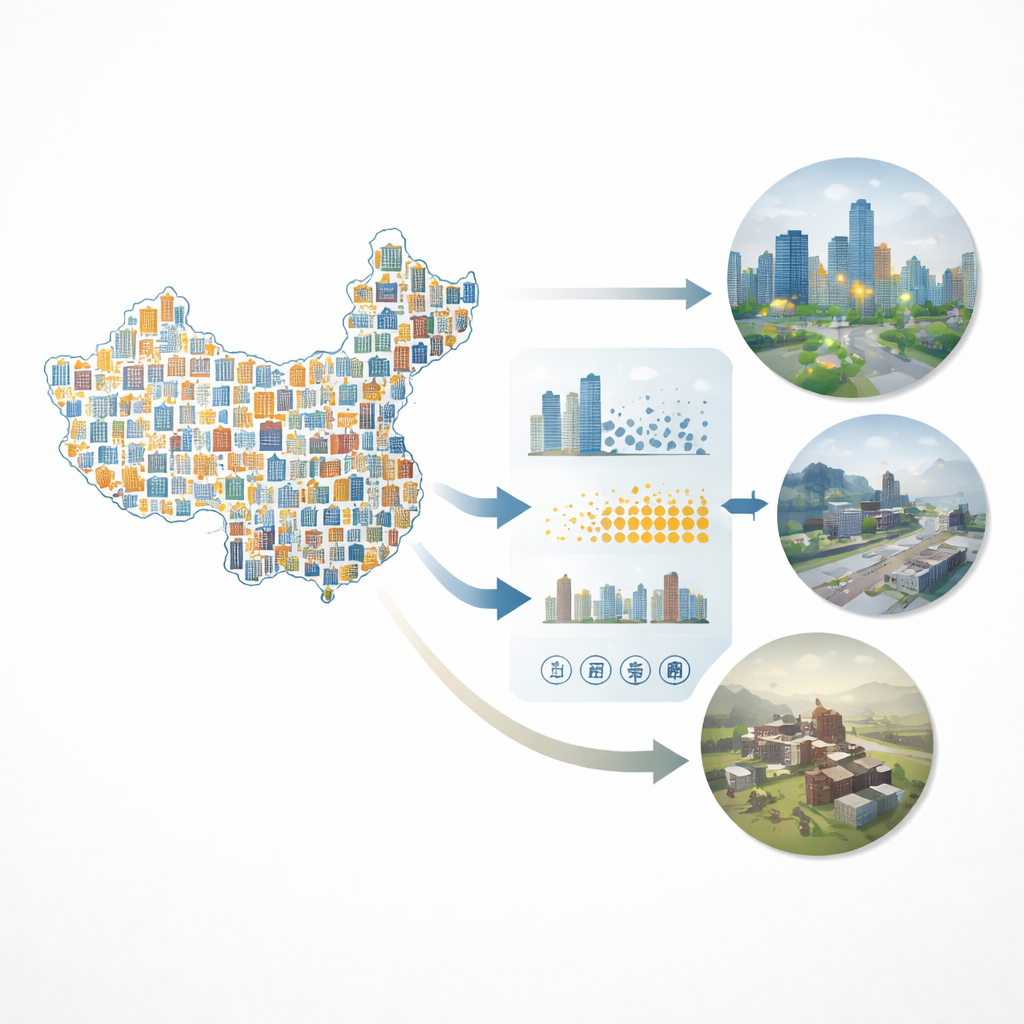
The researchers created a new national map called SinoBF‑1 that identifies the main use of about 110 million buildings in 109 large Chinese cities. Instead of just outlining where buildings stand, the team classified each one into eight everyday types, such as housing, shops and offices, factories, schools, hospitals, and government or community services. They did this by combining sharp optical satellite photos, night‑time light images that show human activity after dark, and height information that reveals how tall structures are. A deep‑learning system learned typical patterns of different building types and was carefully checked using government statistics and millions of field observations collected by a popular mapping service.
Three simple lenses on city life
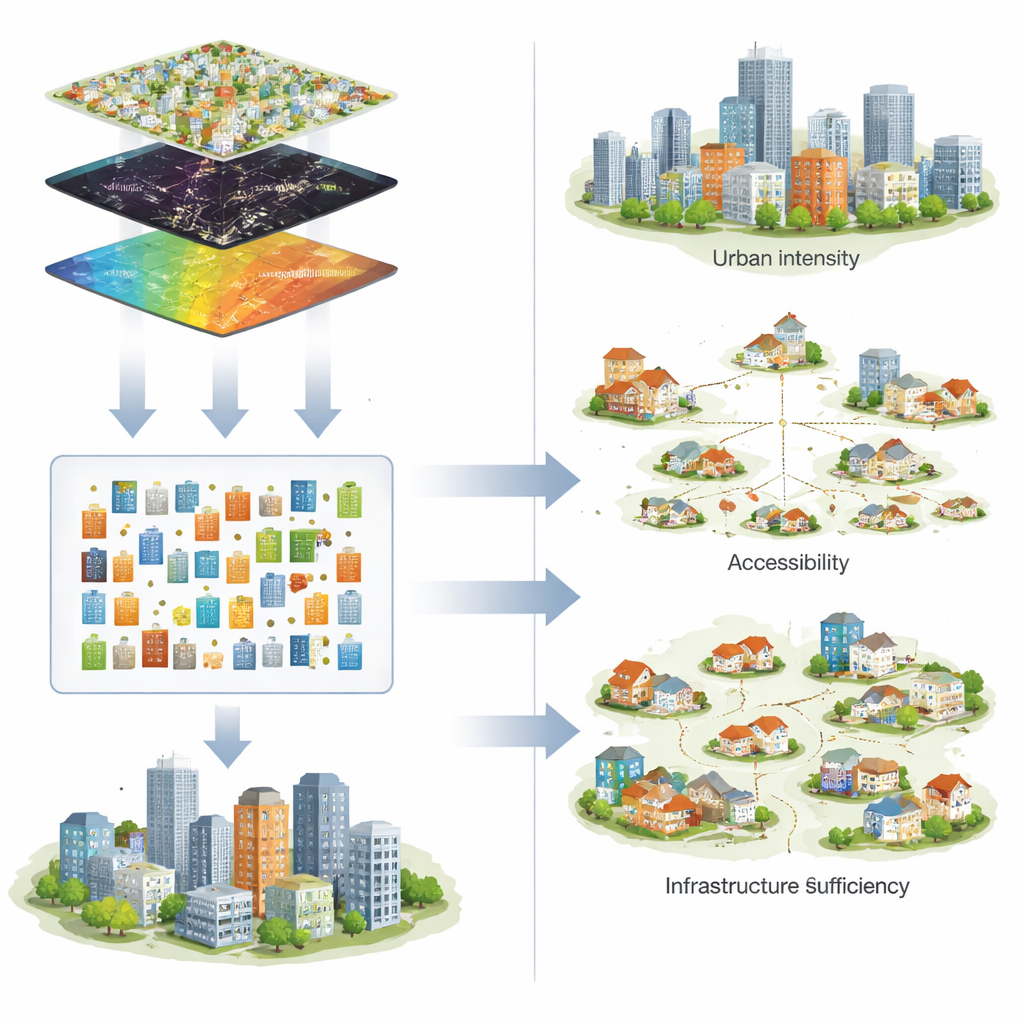
To turn this huge map into a picture of urban living conditions, the authors focused on nine indicators grouped into three easy‑to‑grasp themes. Urban intensity describes how built‑up an area is, using average building height, how tightly packed buildings are, and how bright the city appears at night. Access to services reflects the travel time from each home to the nearest school, health facility, or public service building, calculated along realistic paths using detailed land‑cover and road data. Infrastructure sufficiency looks at whether neighborhoods offer a good variety of facilities, how fairly housing space is shared across the population, and how much hospital and public service floor area exists per person.
Gaps between big, small, north, south, center, and edge
When the team compared these indicators, striking patterns emerged. Top‑tier cities, such as national metropolises, tend to have taller and denser buildings and much better access to schools, clinics, and services: in the best‑served cities, most residents can walk to key facilities in just a few minutes, while in many low‑tier cities people often travel over a quarter of an hour or more. However, mid‑tier cities sometimes provide more even housing conditions than the very largest cities, suggesting that rapid growth can go hand‑in‑hand with inequality. Regional contrasts are equally sharp. Southern and eastern cities generally offer the richest mix of nearby amenities, but their public infrastructure can be crowded, leaving relatively little space per person. Northern and northeastern cities have many housing buildings but fewer supporting services, while the northwest often suffers both poor access and limited diversity of facilities.
Hidden divides within the same city
The study also sliced each city into three zones: long‑established cores, middle belts built during later expansion, and outer fringes. City centers usually give residents the quickest access to schools, hospitals, and public offices and host the most varied set of amenities. Surprisingly, the middle belts often fare worst: they combine high population pressure with lagging infrastructure, leading to the most unequal distribution of housing space. On the fringes, people may live farther from services but, because there are fewer residents, they sometimes enjoy more public space per person. These findings counter the popular notion that new growth zones are automatically better equipped than older neighborhoods.
What this means for fairer cities
For non‑specialists, the key message is that the quality of city life is written into the fine‑grained pattern of individual buildings. By showing exactly where homes, schools, clinics, and workplaces sit—and how they relate to each other—this satellite‑based map exposes uneven access to services and crowded infrastructure that would be invisible in coarse statistics. The approach offers planners and policy makers a powerful tool to target investments, rebalance resources between city tiers and regions, and design new districts that are not just bigger but also fairer and more comfortable for the people who live in them.
Citation: Li, Z., Li, L., Hu, T. et al. Satellite mapping of every building’s function in urban China reveals deep built environment disparities. Nat Commun 17, 2827 (2026). https://doi.org/10.1038/s41467-026-69589-5
Keywords: urban inequality, satellite mapping, building function, China cities, infrastructure access