Clear Sky Science · en
Quantitative nonlinear optical polarimetry with high spatial resolution: erratum
Why Checking the Details Matters
Modern imaging tools can reveal the hidden structure of crystals using light in ways that go far beyond ordinary microscopes. One such method, called nonlinear optical polarimetry, lets scientists map tiny regions inside materials that give them special electrical properties. This short article is an erratum—a formal correction—to an earlier research paper. While the original findings remain valid, the authors discovered that some of their figure labels were swapped, and here they carefully set the record straight. For lay readers, this offers a glimpse into how advanced imaging works and how science corrects itself when small but important mistakes are found.
Light as a Probe for Invisible Patterns
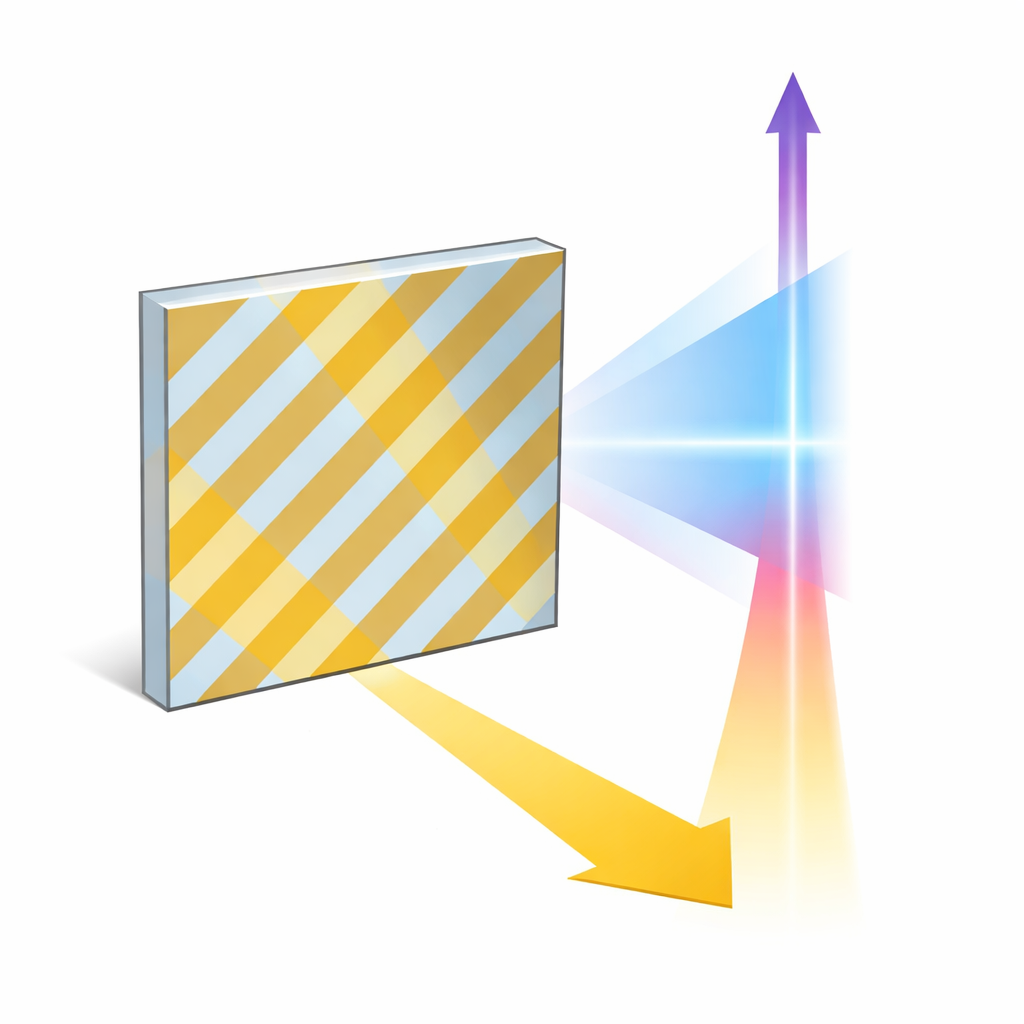
The work centers on a crystal called barium titanate, or BaTiO3, a classic “ferroelectric” material. In such materials, tiny electric dipoles inside the crystal line up, giving each microscopic region a preferred direction, much like small arrows all pointing one way. These regions, known as domains, can point in different directions in neighboring areas, creating a patchwork of internal patterns that are invisible to the naked eye. The original study used a special kind of light–matter interaction, where laser light at one color is converted by the crystal into light at exactly twice the frequency, a process known as second-harmonic generation. By studying how this converted light changes as the incoming light is rotated, the researchers could infer how the internal electric arrows are arranged.
Two Similar Regions, Subtle but Crucial Differences
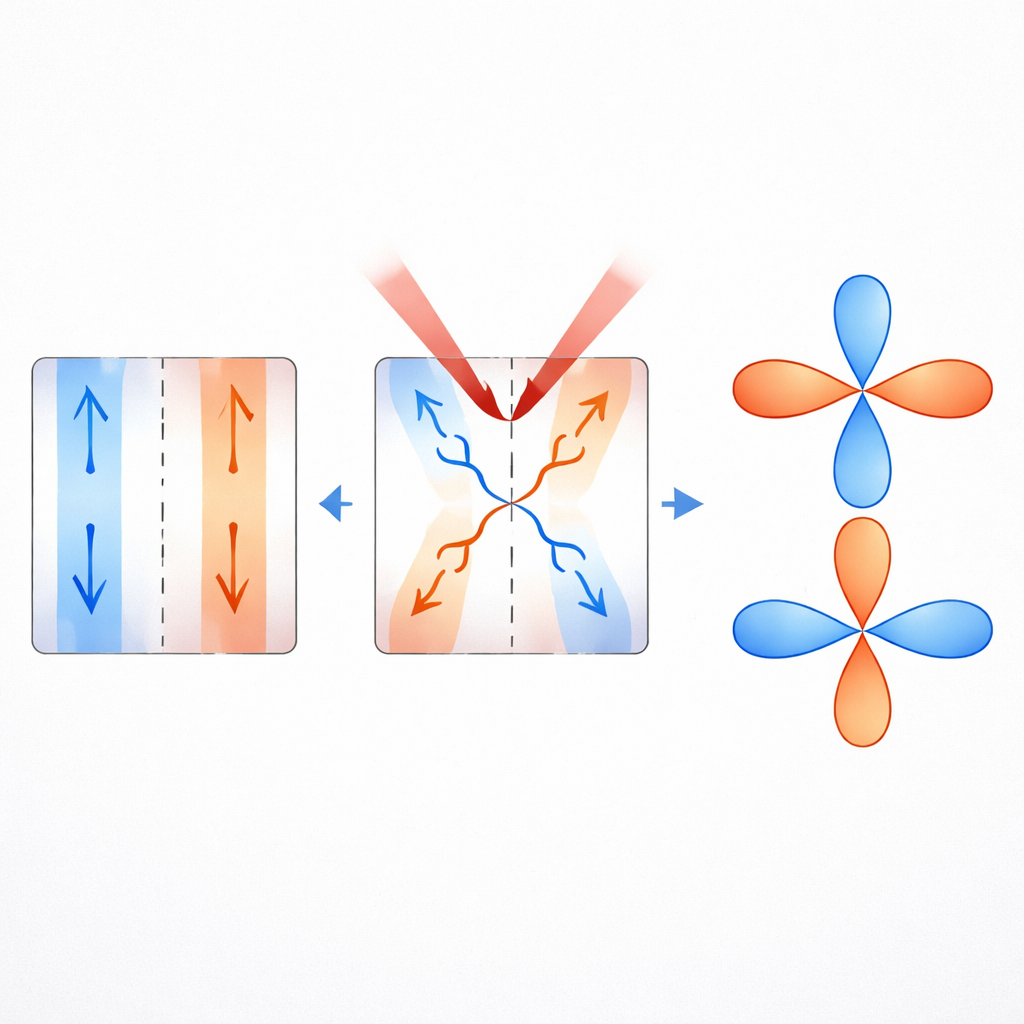
In BaTiO3, the team focused on two types of in‑plane domains, called a1 and a2. These domains are almost identical except that the internal electric arrow lies along two different directions in the lab: one along the horizontal axis and the other along the vertical axis. Although that sounds like a simple rotation, it has a very specific effect on how the crystal responds to light coming from different directions. The response can be expressed mathematically as a “property tensor,” which is essentially a compact way to describe how the material converts incoming light to its doubled-frequency counterpart. When the crystal is viewed in the lab, the same internal pattern must be re‑expressed in lab coordinates, so that the measurements match the geometry of the experiment.
What Went Wrong in the Original Figures
In the original paper, the researchers compared the measured light patterns from these two domain types with theoretical predictions. These comparisons were shown in supplemental plots of polar curves—loop-like shapes that show how the brightness of the doubled-frequency light changes as the incoming light is rotated. However, in preparing the figures, the labels for the a1 and a2 domains in one of the supplemental figures were accidentally swapped. The same mix-up carried over into a main-article figure that displayed an image of the domain pattern and arrows showing the direction of the internal electric polarization in each stripe-like region. As a result, the domains were visually interchanged, even though the underlying data and analysis were handled correctly.
Clarifying the Mathematics Behind the Images
To correct the record, the erratum provides the explicit mathematical forms of the property tensors for the crystal’s basic symmetry and for each of the two domain types, all written out in the lab’s coordinate system. By doing so, the authors remove any ambiguity about how the internal electric directions relate to the measurements that were made. The corrected plots now link the right type of domain to the right pattern of doubled-frequency light, and the image of the domain map shows the arrows pointing in the proper directions for the two stripe-like regions. Importantly, the authors emphasize that these mistakes were limited to how the figures were labeled and assembled, and did not alter the measurements, the theory, or any of the scientific conclusions.
Science That Stays on Track
For readers, the key takeaway is that the advanced imaging method—using second-harmonic light to map ferroelectric domains with high spatial resolution—remains sound. The correction simply ensures that future researchers and students reading the original article will not be misled by swapped labels in a few figures. This erratum is a reminder that even in cutting-edge physics and materials science, careful record-keeping and transparent corrections are an essential part of how science maintains its reliability over time.
Citation: Albert Suceava, Sankalpa Hazra, Jadupati Nag, John Hayden, Safdar Imam, Zhiwen Liu, Abishek Iyer, Mercouri G. Kanatzidis, Susan Trolier-McKinstry, Jon-Paul Maria, and Venkatraman Gopalan, "Quantitative nonlinear optical polarimetry with high spatial resolution: erratum," Optica 12, 1765-1766 (2025). https://doi.org/10.1364/OPTICA.581571
Keywords: second-harmonic generation, ferroelectric domains, barium titanate, nonlinear optical imaging, polarimetry