Clear Sky Science · en
Learning neighborhood-scale cross-dependencies among air pollutants, meteorology and land cover using mobile sensing and transformers
Why Your Street’s Air Is Not Like Your Neighbor’s
City air quality is often described using a single number for an entire neighborhood or even a whole town. Yet in reality, pollution can change sharply over just a few dozen meters—between a busy road and a quiet courtyard, or between a construction site and a park. This study shows how a combination of a sensor-packed electric cart and cutting-edge artificial intelligence can reveal these hidden patterns, and how that knowledge could lead to smarter ways to monitor and manage the air we breathe.
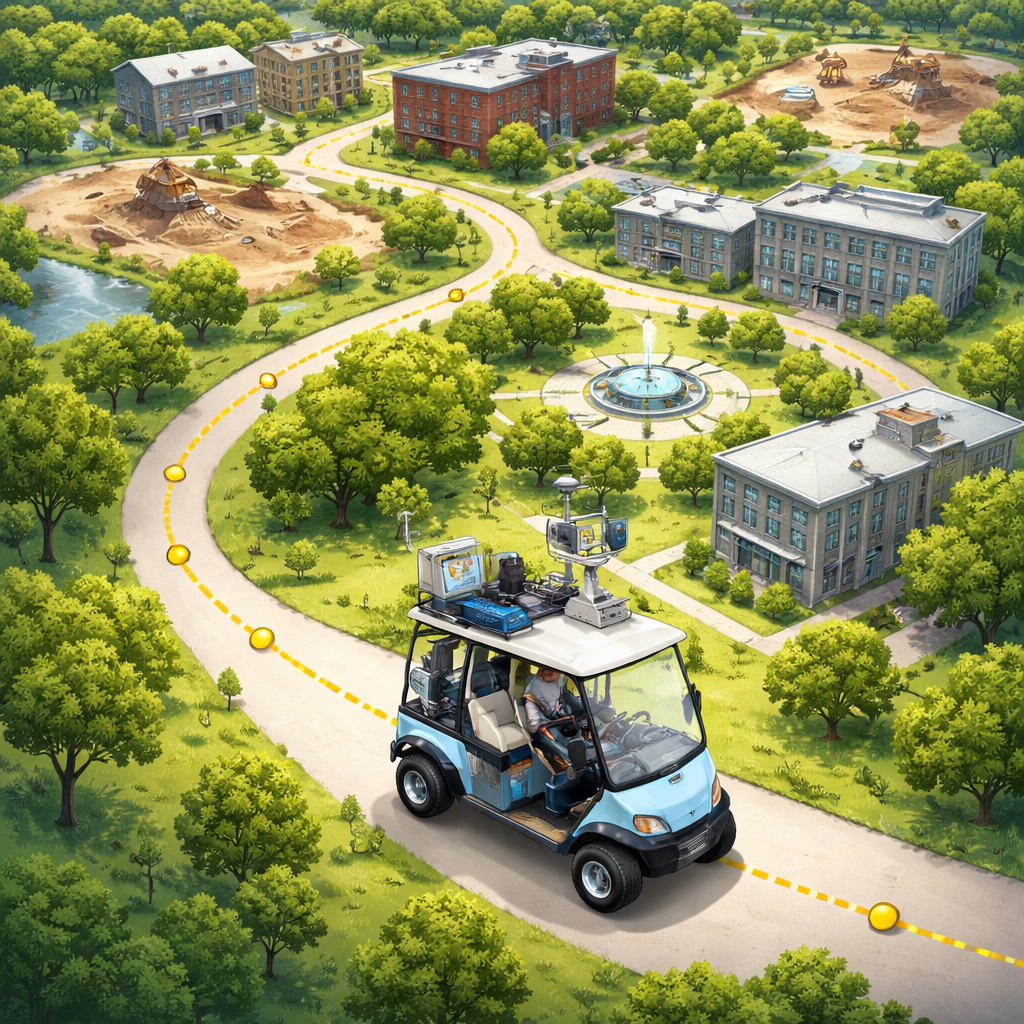
A Rolling Lab on a Campus Loop
The researchers turned an electric golf cart into a mobile air lab and drove it repeatedly around the Weizmann Institute of Science campus in Israel, an area of just 1.1 square kilometers. On board were instruments measuring nitrogen dioxide (a traffic-related gas), ozone, tiny particles (PM1 and PM2.5), temperature, humidity, pressure, and wind. Over three seasons in 2024, they completed 66 surveys along a fixed route with 17 planned stops, collecting about 180,000 measurements at roughly every 5 meters along the path. They then combined these readings with detailed aerial images that showed where buildings, roads, vegetation, and open ground were located, turning the campus into a highly resolved “map” of both pollution and the surfaces it interacts with.
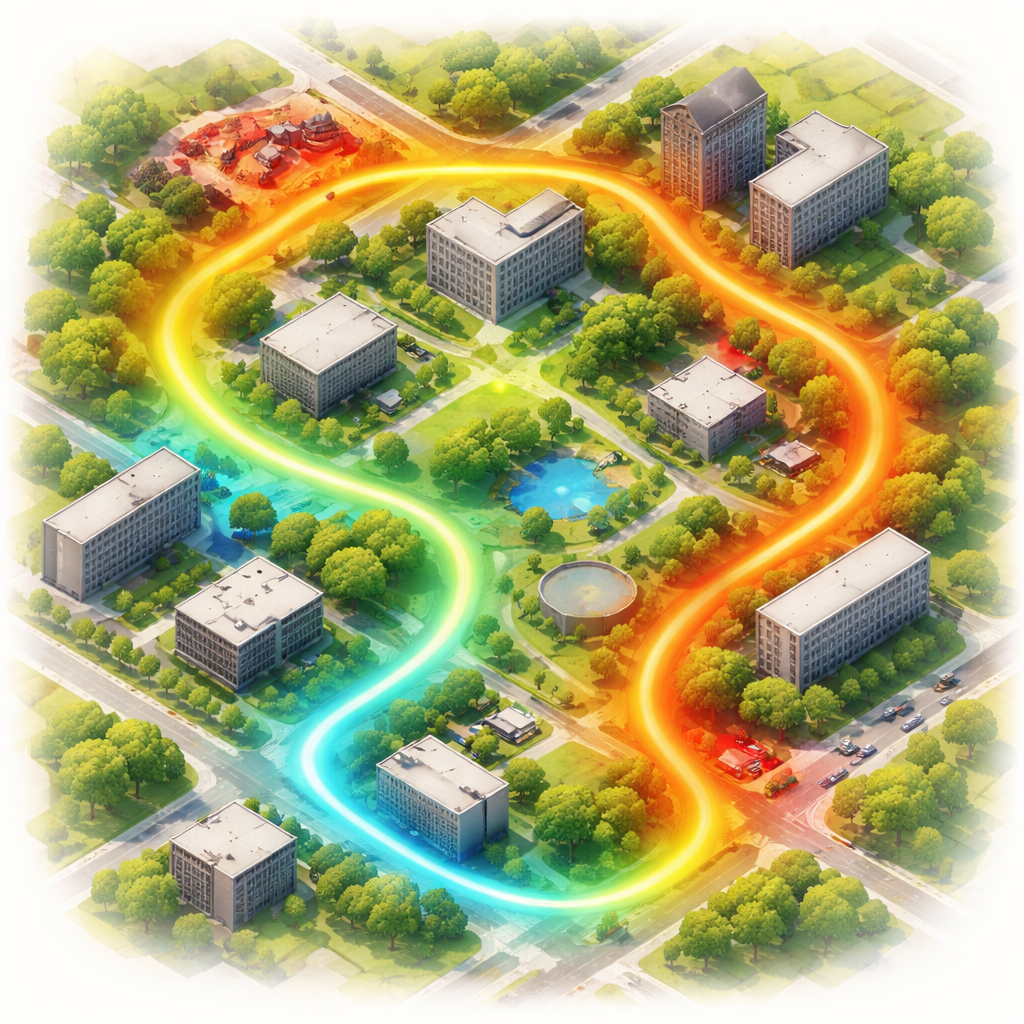
Hidden Hotspots and Daily Rhythms
The maps revealed that pollutant levels can change dramatically over short distances. Nitrogen dioxide in some campus areas was up to twice as high as in others, especially near a main street and close to a nearby highway and cement plant. Construction sites stood out as strong sources of coarse particles, but only under dry conditions—on humid mornings, damp sand produced much less dust. The team also saw strong daily patterns: nitrogen dioxide and fine particles tended to spike in the morning with traffic and then fall as ozone, formed in sunlight, increased toward midday. Ozone itself was surprisingly even across space but varied strongly over the course of the day. These findings underline that “average” city readings can miss intense, short-lived pockets of exposure just a few streets away.
Teaching an AI to Fill in the Gaps
Because it is impossible to measure everywhere at once, the team turned to a modern type of AI known as a transformer—similar in spirit to the models that power advanced language tools. They trained a transformer-based masked autoencoder to take a very limited set of measurements (only a quarter of all map points and variables) and reconstruct the missing three quarters. To compensate for the relatively small real-world dataset, they first pretrained the model on synthetic, computer-generated fields that mimicked complex but realistic patterns. After fine-tuning on the campus data, the AI could reproduce detailed pollution and weather maps with high accuracy, capturing about 89% of the true variability and correctly classifying low to extreme levels into ten categories with strong reliability.
What the Model “Pays Attention” To
Unlike many black-box AI systems, transformers provide a window into how they make decisions through their “attention” patterns—numerical measures of which inputs influence each prediction. By tracking this attention, the researchers could see, for example, that the model often relied on nearby particle data to estimate nitrogen dioxide, and that wind and land-cover information—where roads, buildings, and vegetation were—played an outsized role despite weak simple correlations. Vegetation and buildings were especially important for predicting nitrogen dioxide and PM2.5, highlighting how trees and walls shape airflow and pollutant buildup over very small scales. Wind data, even when noisy on a moving cart, still carried valuable clues about how pollution plumes spread and dilute.
Designing Smarter Monitoring with Fewer Measurements
Because the transformer can work with flexible sets of input points, the team tested using only the most “informative” locations identified by the attention maps. They found that, instead of randomly sampling 25% of the campus, they could choose a handful of key spots—sometimes as few as 15 points across the whole site—and still reconstruct the main pollution and weather patterns better than a standard statistical method. This suggests a new way to plan monitoring routes and sensor placement: let an AI trained on past surveys highlight the places where each new reading buys the most information, cutting costs while preserving scientific value.
What This Means for People Breathing the Air
For non-specialists, the core message is straightforward: the air quality you experience walking down your own block can be very different from what a distant station reports, and those differences depend on nearby traffic, buildings, trees, and even construction timing. This study shows that a small fleet of mobile sensors, guided and interpreted by explainable AI, can chart these neighborhood-scale variations in remarkable detail. In the long run, such approaches could help city planners decide where to plant trees or reroute traffic, guide health studies that better reflect real exposure, and enable leaner, smarter monitoring networks that keep closer track of the air we actually breathe from door to door.
Citation: Nissenbaum, D., Bagon, S., Sarafian, R. et al. Learning neighborhood-scale cross-dependencies among air pollutants, meteorology and land cover using mobile sensing and transformers. npj Clean Air 2, 13 (2026). https://doi.org/10.1038/s44407-026-00054-9
Keywords: urban air pollution, mobile sensing, transformer models, neighborhood-scale mapping, air quality monitoring