Clear Sky Science · en
Encoding functional edges in graphs to model spatially varying relationships in the tumor microenvironment
Why mapping cancer’s neighborhood matters
Cancer does not grow in isolation. Tumor cells live in a bustling neighborhood of immune cells, support cells, blood vessels, and chemical signals, all crowded together in space. How these neighbors are arranged and how strongly they influence one another can determine whether a cancer spreads, responds to treatment, or stays in check. This article introduces SPIFEE, a new artificial intelligence framework that turns microscopic images and molecular maps of tumors into networks, helping researchers pinpoint which cell and pathway interactions are most tied to disease type and patient outcome.
Turning tissue into a network map
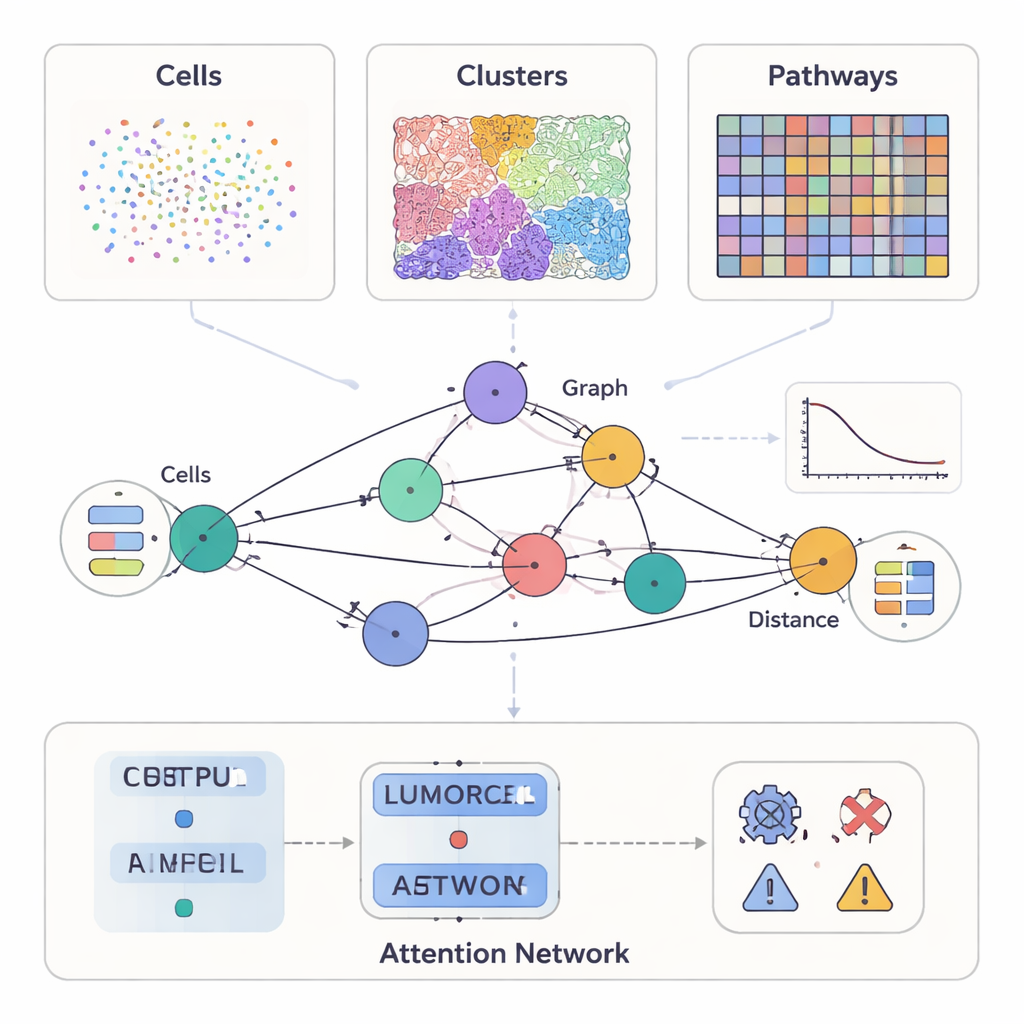
Modern cancer studies can measure much more than how a tumor looks under the microscope. Some methods highlight dozens of proteins on individual cells, others provide detailed color slides of tissue structure, and newer tools record which genes are active at thousands of spots across a slice of tumor. SPIFEE treats all of these as different views of the same neighborhood. It represents each sample as a graph: nodes stand for key entities in the tumor microenvironment—such as cell types, visual tissue patterns, or molecular pathways—while edges capture how these entities interact across space. Crucially, SPIFEE does not reduce an interaction to a single number like “distance.” Instead, each edge stores a small curve describing how strongly two entities mix or repel each other over a range of distances, preserving much richer spatial detail.
A flexible lens on many kinds of cancer data
The authors tested SPIFEE on several large, independent cancer datasets spanning different technologies and scales. In pancreatic disease samples labeled with multiplex immunofluorescence, each node in the graph represented a cell type, and node features came from single-cell RNA sequencing that summarized how those cells tend to communicate. In lung cancer slides stained with the routine hematoxylin and eosin method, nodes represented recurrent visual patterns of tissue, discovered automatically by a self-supervised learning system. In a third setting, standard lung cancer slides were converted by a deep-learning tool into virtual spatial transcriptomics, and SPIFEE nodes represented molecular pathways such as hypoxia, estrogen, or JAK–STAT signaling, with features derived from gene activity. Across all of these settings, the same framework could ingest different node types and still build comparable spatial graphs.
Finding the interactions that separate health outcomes
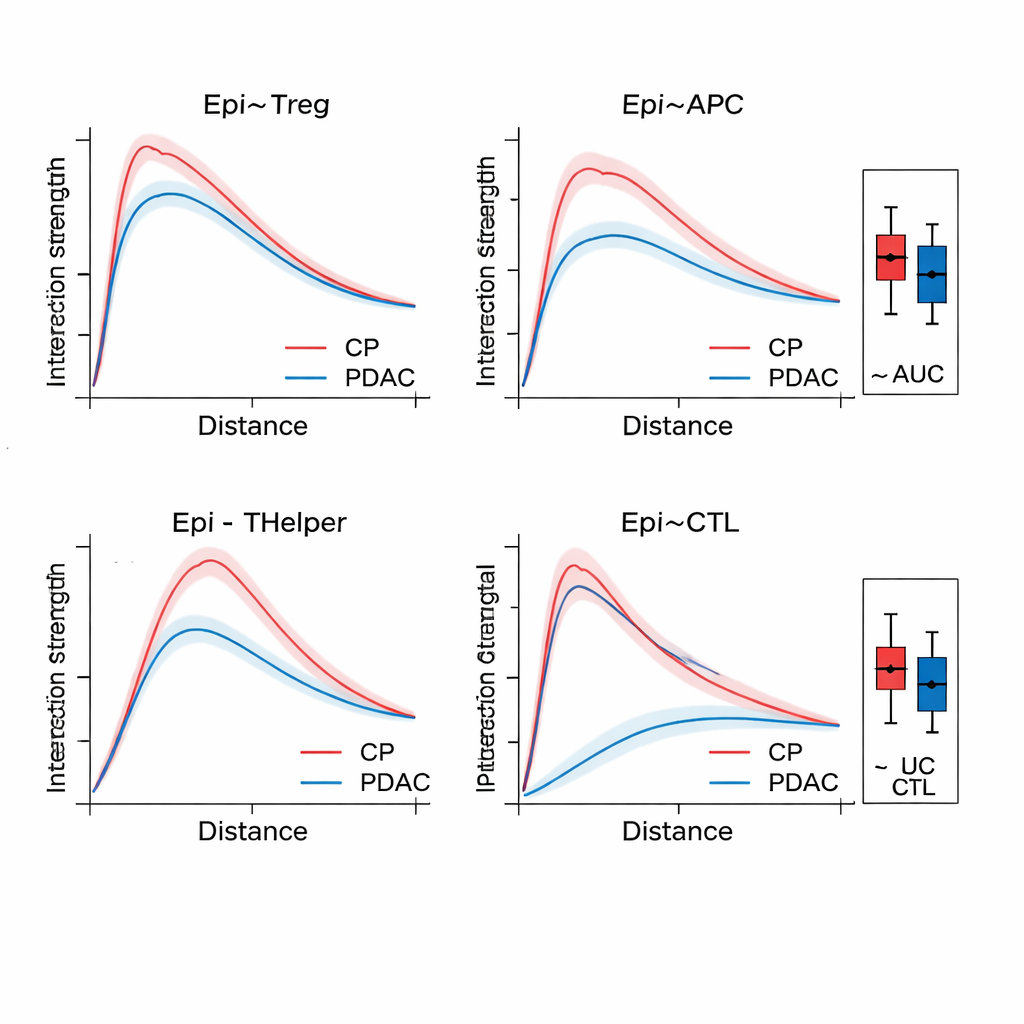
Once SPIFEE builds a graph, it passes it through a graph attention network, a kind of neural network that learns not only to predict an outcome—such as cancer subtype, survival risk, or disease versus non-cancerous inflammation—but also to highlight which edges mattered most for that prediction. In pancreatic tissue, SPIFEE distinguished chronic pancreatitis from pancreatic ductal adenocarcinoma with higher accuracy than earlier graph-based methods. The model consistently focused on interactions involving epithelial (tumor-like) cells and regulatory T cells, antigen-presenting cells, and helper T cells, pointing to an immunosuppressive neighborhood that is more prominent in cancer than in inflammation. In lung adenocarcinoma slides, SPIFEE identified particular stromal-tumor patterns whose interactions correlated with better or worse survival, suggesting that the “border zones” between tumor and supportive tissue encode important prognostic clues that standard analyses may miss.
Reading molecular crosstalk from routine slides
Perhaps most strikingly, SPIFEE could infer meaningful pathway interactions from ordinary pathology images once they were translated into predicted gene-activity maps. By treating pathways as nodes and their spatial co-occurrence as functional edges, the method highlighted pairs such as hypoxia with EGFR or JAK–STAT with PI3K—combinations already known to drive immune evasion and drug resistance in lung cancer. It also elevated estrogen-related pathways in lung adenocarcinoma and certain immune and stress pathways in squamous tumors, findings that lined up with patterns seen in bulk RNA sequencing and in an independent, real spatial transcriptomics dataset. This suggests that, even when molecular measurements are approximated, spatial patterns in routine slides still carry recoverable signals about how key pathways interact in living tumors.
What this means for future cancer care
To a non-specialist, the key message is that SPIFEE offers a new way to read the “social life” of cancer cells directly from images and molecular maps. By encoding how relationships change with distance instead of flattening them to single scores, and by using attention-based neural networks to rank which interactions matter most, the framework can uncover combinations of cells, tissue patterns, and pathways that distinguish cancer types and predict survival. While these findings still need biological and clinical validation, approaches like SPIFEE point toward a future in which routine tumor samples can yield not just static snapshots, but dynamic maps of interaction hotspots that help guide diagnosis, risk stratification, and eventually personalized therapy choices.
Citation: Tsang, A.P., Krishnan, S.N., Kulkarni, R. et al. Encoding functional edges in graphs to model spatially varying relationships in the tumor microenvironment. npj Artif. Intell. 2, 27 (2026). https://doi.org/10.1038/s44387-026-00075-5
Keywords: tumor microenvironment, spatial transcriptomics, graph neural networks, cancer pathology, cell-cell interactions